Current Landscape & Sentiment Drivers
BRETT (Based), trading as BRETT/USDT, is sitting at around $0.00763 right now, showing a modest +3.33% bump over the past 24 hours. Most analysts agree that the token is stuck in a bearish long-term trend, though there are some signs that short-term oversold conditions might give us a temporary relief bounce. The daily moving averages—especially the 50-, 100-, and 200-period EMAs and SMAs—are all hanging well above the current price, which keeps the pressure tilted downward. That said, the shorter 10-period SMA and EMA are looking a bit flatter, maybe even slightly bullish, suggesting there’s tentative support somewhere between $0.0070 and $0.0074.
Looking at the bigger picture, there are some interesting macro factors and structural developments in play. BRETT’s connection to the Base blockchain—which is Coinbase’s layer-2 network—has helped fuel ecosystem growth through increased user adoption, rising dApp volumes, and liquidity mining through platforms like Aerodrome. But there are legitimate concerns too. A lot of insiders held large chunks of tokens at launch, volatility has been wild, and there’s ongoing speculation about whether major exchanges like Coinbase will actually list BRETT for spot trading. All of this adds up to a classic high-risk, high-reward situation.
Technical Indicators Breakdown
Momentum & Trend Strength
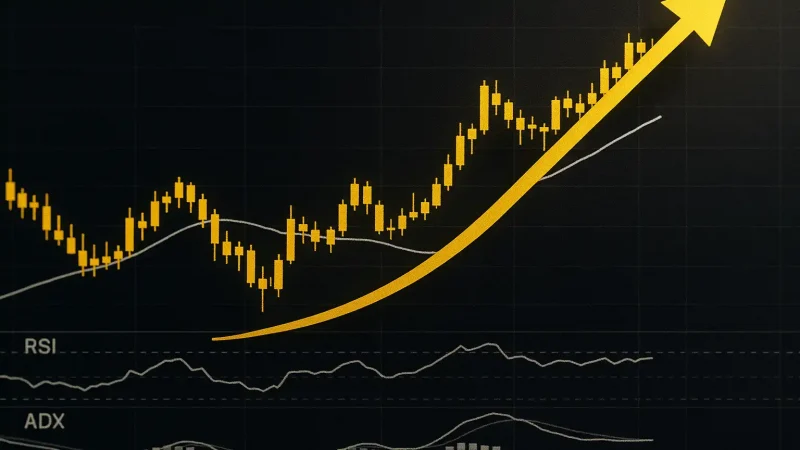
The Relative Strength Index (RSI) on the daily timeframe is hovering in a neutral to mildly oversold zone—somewhere around 42 to 43. This tells us that while selling pressure has eased up a bit, we haven’t seen a strong reversal yet. The Average Directional Index (ADX) is sitting above 30, which confirms that the bearish trend still has some teeth. On top of that, the Parabolic SAR signals are positioned above the price, further reinforcing that downward momentum.
Moving Averages & Volatility
BRETT is trading well below all the major long-term moving averages—the 50, 100, and 200 period SMAs and EMAs—so the downtrend is pretty clear. The shorter-term averages, like the 10-period, have occasionally crossed above the price, but those moves haven’t stuck. There’s solid resistance waiting around $0.010 to $0.011. Volatility remains elevated based on the Average True Range (ATR) on daily charts, meaning the price swings are still pretty big in percentage terms. That creates both opportunity and risk, depending on which side of the trade you’re on.
Support, Resistance & Key Levels
The most important support zone sits around $0.0061 to $0.0065. This area has held up during past sharp sell-offs, so it’s worth watching closely. On the flip side, resistance is clustered between $0.0090 and $0.0100, with another layer up near $0.013 to $0.015. These zones line up nicely with Fibonacci retracement levels drawn from previous high-to-low moves. If support breaks, things could accelerate to the downside quickly. Breaking through resistance, on the other hand, is going to require serious volume and momentum.
Price Forecast & Scenarios
Bullish Upside Scenario
If buyers manage to reclaim the $0.0090 to $0.0100 resistance zone and push above the 50-period EMA/SMA, BRETT could kick off a decent corrective rally. In that scenario, we might see targets around $0.013 to $0.015—especially if the broader market sentiment shifts in favor of meme tokens and altcoins, and if Base blockchain metrics like total value locked (TVL) and active wallets keep trending upward. A major catalyst—think a spot listing on Coinbase or Binance, or a surprise ecosystem upgrade—could really accelerate things. For confirmation, traders should watch for higher highs and higher lows on the 4-hour and daily charts, backed by strong volume.
Bearish Downside Scenario
If the support between $0.0061 and $0.0065 gives way, particularly on heavy volume, the next stop could be down around $0.0050 to $0.0055. With so many long-term moving averages still sitting well above the current price, any downside move gets reinforced by that structural resistance overhead. A broader downturn in risk assets, or negative news like centralization concerns or tighter regulations, could weigh heavily on BRETT. For traders using tight stop-losses, a drop back to $0.006 should be treated as a serious warning sign.
Strategic Implications for Investors & Traders
Given where the technicals and sentiment sit right now, a tactical and risk-conscious approach makes the most sense. If you’re looking to swing trade, the best entry points are probably near those key support zones—around $0.0065 to $0.0070—with stop-loss orders placed just below proven support levels. For longer-term investors, keep a close eye on ecosystem development, exchange listings, and Base chain metrics. Those factors will likely determine whether BRETT becomes more than just another meme coin riding on momentum. And whatever you do, avoid jumping into long positions near resistance unless you see strong volume backing the move.