Current Market Context and News Introduction
ConstitutionDAO (PEOPLE) is currently trading at around 0.00661634 USDT, down roughly −1.30% over the past 24 hours. After months of ups and downs, PEOPLE has entered what looks like a quiet phase with not much volume or momentum happening. Looking at the bigger picture—daily and weekly charts—we can see some pretty brutal drops from highs above $0.018, mostly due to heavy selling and weak attempts at recovery. In the past, the token found some footing around the $0.011–$0.012 range, but right now we’re way below that, which tells us there’s been serious selling pressure weighing things down.
Technical Indicators and Key Levels
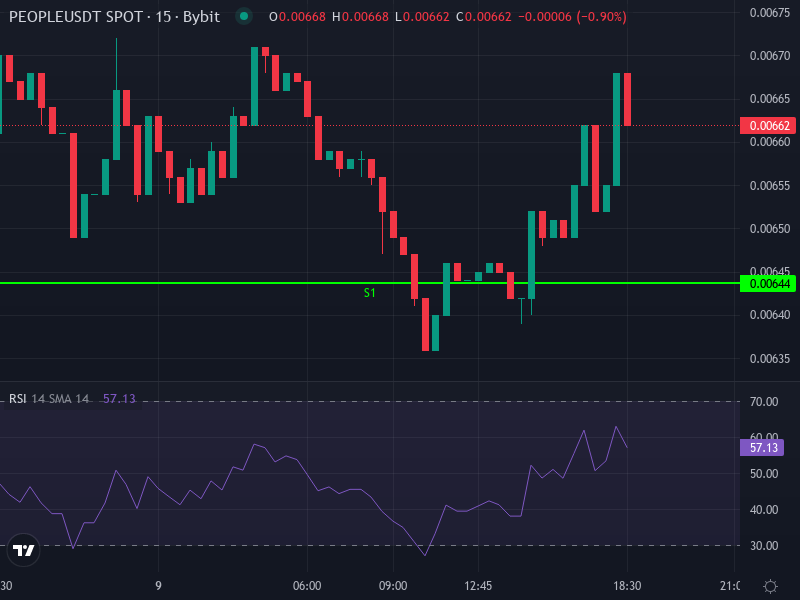
When you check the 4-hour chart, the RSI sits at about 38.5. That puts PEOPLE in mildly bearish territory—not exactly crashing, but definitely leaning negative without being oversold just yet. The MACD line is barely above its signal line (histogram around +0.00000319), hinting at a possible bullish crossover. But honestly, it’s pretty weak and could easily flip back without some real buying support. Both the 4-hour SMA (around 0.00684233) and EMA (roughly 0.00689281) are sitting well above where we’re trading now, which reinforces that we’re still in a downtrend and these moving averages are acting as overhead resistance.
Looking at daily pivot points, we’ve got resistance at R1 around 0.00682667 USDT, with R2 and R3 stacking up at about 0.00705–0.00722 USDT. On the flip side, support shows up at S1 near 0.00643667, S2 at 0.00627333, and deeper support at S3 around 0.00604667 USDT. Since the current price is hanging between S1 and the pivot point (roughly 0.00666333), pushing above the pivot toward R1 would need some real buyer interest to kick in. But if we drop below S2, things could get ugly fast heading toward S3.
Short-Term Scenarios (Next 24-72 Hours)
1. **Bearish continuation**: Since we’re trading below both the SMA and EMA on the 4-hour timeframe, and the MACD crossover is barely there, the easier path right now seems to be down. If sellers get more aggressive and we break through S2 (around 0.00627), we could be looking at a test of S3 near 0.00604667. Watch for volume spikes during drops—that would confirm the bearish move.
2. **Possible turnaround**: If we manage to close above the daily pivot (0.00666333), there’s a chance we could squeeze higher toward R1 at 0.00682667. But for that to happen, we’d need better momentum—think stronger MACD action, RSI climbing back above 50, and decent volume coming in. Without those things, any bounce is probably short-lived and will likely get smacked down near the SMA/EMA resistance zone.
Mid-Term Projection and Risk Considerations
Over the next week or two, PEOPLE will probably bounce around between about 0.00600 USDT on the downside and maybe 0.00700 USDT if things get a bit more positive. Breaking above 0.00722 USDT (Daily-R3) seems pretty unlikely right now since there’s no obvious catalyst, and the volume just isn’t there. On the other hand, if we punch through S3 at 0.00604667, we could see acceleration to the downside—maybe hitting 0.00550 USDT or even lower, especially if the broader crypto market takes a hit.
There are some real risks to keep an eye on here. Low liquidity can cause nasty slippage, there’s no strong story or fundamental reason driving PEOPLE right now, and there’s always the chance that big holders decide to dump their bags. That tiny MACD crossover we’re seeing today doesn’t change the fact that the 4-hour charts still favor the sellers in the short term. Plus, with RSI below neutral and both moving averages trending downward, the traditional indicators are all flashing caution signs.
Implicit Price Prediction Ranges
Here’s how things could play out based on the technicals:
• **Bearish scenario**: We could slide toward S3 around 0.00604667 or lower, potentially hitting **roughly 0.00550 USDT** if support levels crack and the bearish momentum keeps going.
• **Most likely scenario**: Price probably trades sideways in the **0.00640–0.00690 USDT** range, bouncing between S1 and the pivot with resistance showing up at R1.
• **Bullish scenario**: If buyers actually show up and push past the SMA/EMA resistance (around 0.00684–0.00689), we might see a climb to R2 or R3 in the 0.00705–0.00722 USDT zone. But that would need solid volume and some help from the overall market looking stronger.