Recent Developments & Fundamental Drivers
Pythia has been making waves in the crypto space with its unique approach to decentralized science and Web3 reputation systems. The project’s parent company, Orama Labs, recently teamed up with Kingnet Capital—a heavyweight in Asian Web3 gaming—to build tokenization protocols for scientific research and intellectual property. These aren’t just buzzwords; the planned LaunchPad and partnerships point to genuine real-world applications that go beyond the typical hype cycles we see in crypto. This kind of utility could actually drive sustainable growth rather than just speculative pumps.
On top of that, Pythia just rolled out a reputation platform designed specifically for crypto content creators. It’s got some interesting features like prediction markets and soulbound Reputation Tokens, and they’re working with established names like Chainlink and Kleros. While this expands PYTHIA’s potential use cases beyond just DeSci, it also means the token’s success will depend on how well these platforms are actually adopted by users. More utility is great, but it also means more variables in play.
Technical Picture: Indicators & Price Action
Right now, PYTHIA/USDT is trading around $0.03414, up roughly 9.56% over the last 24 hours. The short-term momentum looks pretty encouraging—most of the major moving averages like the 10-day, 20-day, and 50-day are flashing buy signals. The MACD on daily charts is starting to curve upward, which suggests the bearish momentum might be losing steam. The RSI is climbing too, but it’s still in healthy territory and not screaming “overbought” just yet, so there could be room to run.
That said, zoom out a bit and the picture isn’t quite as rosy. We’re still way down from the all-time high around $0.1259, and the longer-term trend remains bearish. Both the 50-day and 200-day exponential moving averages sit above the current price, acting as overhead resistance. Most technical analysis platforms are still rating this as a “Strong Sell” or “Bearish” on the weekly and daily timeframes. Plus, volatility is still running high, which means we could see sharp moves in either direction if key levels break.
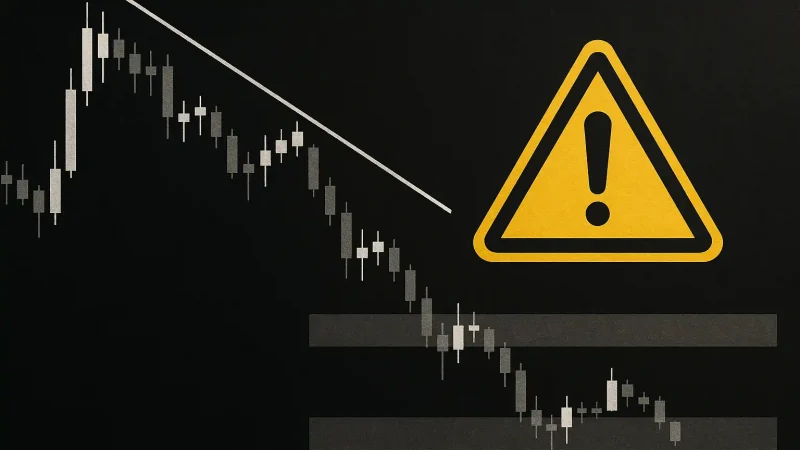
Support & Resistance Levels to Watch
Support zones:
• Around $0.030–$0.032 → These levels have held up before and represent important swing lows.
• $0.025 or lower → This is a key psychological level and a longer-term retracement zone if things turn south.
Resistance zones:
• First barrier: roughly $0.045–$0.050 where several short-term moving averages are clustering.
• Bigger challenge: around $0.055–$0.060 which aligns with previous highs and the 50/100 EMA region.
Forecast Scenarios Based on Technical Indicators
Looking at how the charts are set up right now, there are a few different ways this could play out depending on market conditions and whether any major catalysts materialize.
Scenario A — Bullish Reversal: If PYTHIA manages to push through the $0.045 resistance with solid volume and actually holds above the 200-day EMA, we could see a move toward $0.060. This would need some help from the fundamentals though—like real adoption of the reputation platform or tangible progress from the LaunchPad. Without those catalysts, breaking resistance might prove difficult.
Scenario B — Range Bound / Slow Climb: There’s a decent chance we just chop around between $0.030 and $0.045 for a while. Buyers might defend the support levels well enough, but without strong conviction, they may not be able to punch through resistance. In this scenario, expect sideways price action with decent volatility. The RSI would probably hover in neutral territory, and the MACD might show weak crossovers without much follow-through.
Scenario C — Bearish Continuation: If that $0.045–$0.050 resistance proves too tough to crack, and broader market sentiment turns sour or regulatory concerns pop up, we could easily see a drop back toward $0.025 or even lower. Warning signs would include the RSI rolling over, MACD showing bearish divergence, and moving averages continuing to point downward. This is definitely a scenario to keep in mind.
Implications for Traders & Investors
If you’re trading short-term, keep a close eye on intraday volume and watch for clean breakouts above those key resistance levels. Don’t ignore RSI getting into overbought territory—that’s often where moves stall out. Day traders could do well playing the range between $0.030 and $0.050, especially with the current volatility creating plenty of opportunities for quick moves.
For those thinking longer-term, the fundamentals matter more than the charts. Pay attention to whether the reputation platform actually gains users, if the LaunchPad launches successfully, and how the team handles any regulatory or ethical challenges around content creator reputation systems and DeSci applications. If you believe in the project, buying dips near strong support around $0.030–$0.032 could offer a decent risk-reward setup—just make sure you’ve got stop-losses in place below those support levels to protect yourself if things break down.