Market Context & Recent Developments
Mog Coin is currently trading at around 0.000000193 USDT, showing a modest gain of about +2.91% over the past 24 hours. This small uptick is happening while the broader meme-coin market experiences quite a bit of volatility. We’ve seen major players like BONK and PEPE posting some impressive gains recently, but now there’s a noticeable shift in sentiment as traders seem to be playing it safe. This cautious approach is putting pressure on speculative assets like MOG. The technical picture isn’t helping either—prices have dropped below key short-term moving averages, and the Fear & Greed Index is running hot, suggesting many traders are cashing out their profits instead of betting on further gains.
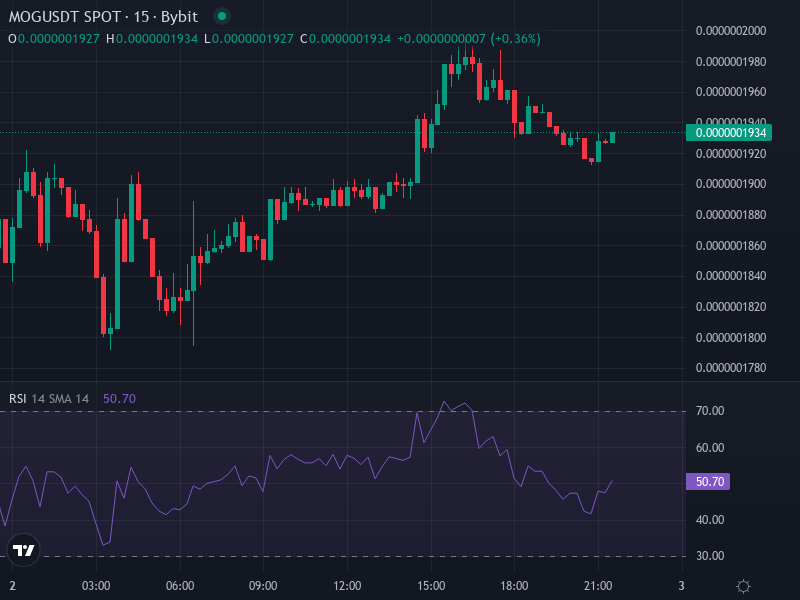
When you look at the recent trends, MOG has fallen below both its 7-day and 30-day simple moving averages, which really reinforces the bearish momentum we’re seeing. The RSI is sitting in uncomfortable territory near oversold levels (below 35), and the MACD is flashing negative momentum signals. Bulls are clearly having a tough time taking back control here. The big level everyone’s watching is that resistance around $0.00000092—it’s been a stubborn barrier for a while now, and breaking through it could really signal the start of something more promising.
Technical Indicators & Price Pathways
The technical setup right now is showing us both opportunities and warnings. Let’s break down what the charts are telling us:
Bulls in Action: Recovery Setup
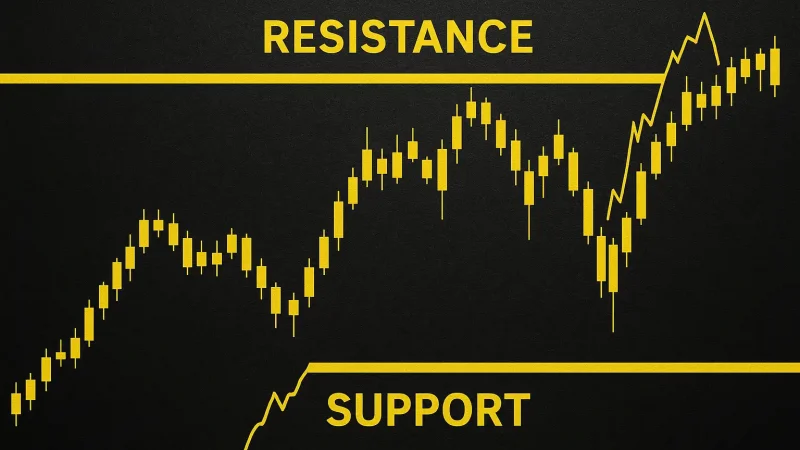
There’s actually some encouraging action happening beneath the surface. MOG’s chart is showing a nice U-shaped recovery pattern from recent lows, and the Chaikin Money Flow has climbed up to around +0.22, which tells us buying pressure is building. When you zoom out to the weekly timeframe, it looks like we might be breaking out above the upper line of a descending triangle—that’s typically a bullish signal. If this momentum continues, we could see MOG push toward $0.0000016 in the near term, with some optimistic analysts even eyeing $0.0000030 if conditions really align. The levels to watch on the way up are resistance zones at $0.00000092 and around $0.00000172.
Bears Remain a Threat: Key Support to Watch
Now, if MOG can’t break through those resistance levels, we’ve got to be realistic about the downside risks. There’s solid support sitting near $0.00000065, and if that level gives way, we could be looking at a slide down to $0.00000045 or even lower. Both the 50-day and 200-day moving averages are currently above the price, which means they’re acting as overhead resistance that needs to be reclaimed for any sustained rally. The momentum indicators are also flashing warning signs—that low RSI might mean we’re in for more downside, or at the very least, a long period of sideways trading.
Mid- to Long-Term Outlook & Forecasts
If the bullish signals we’re seeing now can hold up and MOG manages to attract consistent trading volume along with continued community engagement and exchange support, the medium-term outlook gets pretty interesting. By late 2025, prices somewhere between $0.0000012 and $0.0000024 seem realistic. Some of the more optimistic forecasts are pointing toward $0.0000050–$0.0000058, though that would require strong momentum across the entire memecoin sector plus favorable market conditions overall. Looking even further out to 2026, there’s potential for MOG to reach $0.0000040 or beyond—but that’s really dependent on the project developing actual utility, improving its tokenomics, and securing more exchange listings. On the flip side, if the hype fades and accumulation stays weak, we could see prices drift down to **$0.00000039–$0.00000052** if those key support levels don’t hold.
Monitoring Signals & Break Points
If you’re watching MOG closely, here are the signals and levels that really matter:
- A daily close above $0.00000092 would be a strong sign that the trend is reversing to the upside.
- Holding that immediate support near $0.00000065 is crucial—losing it could trigger deeper declines.
- Watch for a MACD crossover on the daily or weekly charts; a bullish cross would confirm momentum is shifting.
- RSI climbing out of oversold territory (moving above roughly 40) without shooting into overbought levels.
- Volume spikes on breakout days—this is absolutely critical with memecoins since they’re so sentiment-driven.
Potential Catalysts and Risks
On the positive side, there are several things that could really push MOG higher. New listings on major exchanges would be huge, as would any developments around token utility like staking programs or burn mechanisms. Continued social media momentum and community growth can’t be underestimated either. But let’s be honest about the risks too. MOG, like many memecoins, relies heavily on hype without strong fundamentals backing it up. Broader economic headwinds or a general loss of interest in meme tokens could amplify any losses quickly. With any high-volatility token like this, proper risk management and careful position sizing aren’t just recommended—they’re absolutely essential.