Market & Fundamental Context
Pepe coin has been turning heads in early 2026 as memecoins make a serious comeback. In just the first week of January, PEPE surged more than 30%, helping push the broader memecoin market cap up by around 20% on massive trading volumes. One well-known crypto voice even called for PEPE to hit a market cap north of $69 billion by year’s end, which naturally got traders excited and drove plenty of speculative action. That said, plenty of analysts are waving caution flags—PEPE doesn’t really do much, regulation could become an issue, and let’s be honest, memecoins have a pretty wild history of pumping hard then dumping harder. Right now though, risk appetite is running high.
Key Technical Indicators & Current Setup
PEPE is hovering around $0.0000045783 against USDT, down roughly 1.11% over the last 24 hours. Looking at the 4-hour chart, the Relative Strength Index is sitting near 36—not quite oversold, but definitely showing some bearish or neutral vibes. The MACD tells a similar story: both lines are below zero, with the MACD just under the signal line and a slightly negative histogram. Translation? There’s some bearish pressure, but we’re not seeing a full-blown selloff just yet. The 4-hour simple moving average is parked around $0.0000048490, and the exponential moving average is a hair lower at roughly $0.0000047975. Both are acting as overhead resistance for now.
Daily pivot points give us a clearer picture of the battlefield. The main pivot sits at about $0.0000045967. Resistance levels stack up at approximately $0.0000046333 (R1), $0.0000046767 (R2), and $0.0000047133 (R3). On the flip side, support zones line up near $0.0000045533 (S1), $0.0000045167 (S2), and $0.0000044733 (S3). Over the past day, PEPE dropped about 10.87%, which hints at choppy waters ahead and raises the real possibility of sliding toward those support levels if buyers don’t step up soon.
Price Chart
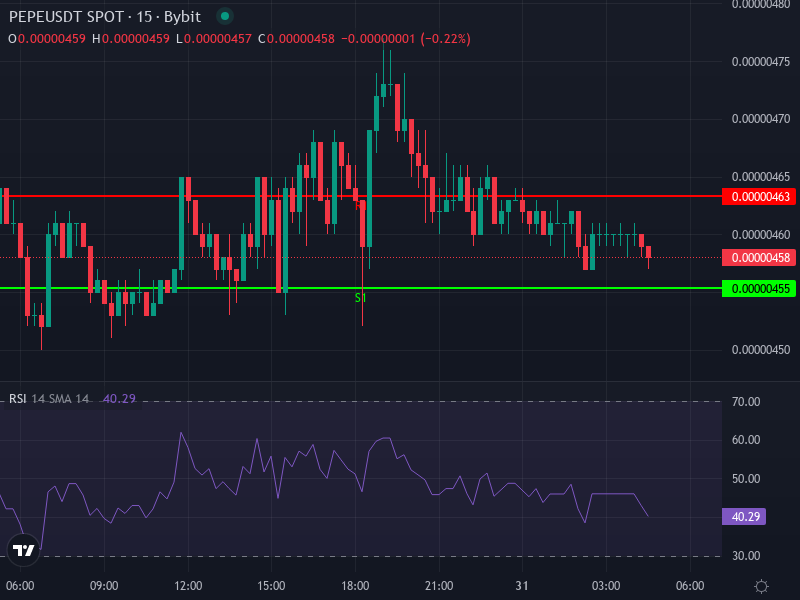
Price Prediction Scenarios: Upside vs. Risk
Bullish Case
If PEPE can push back above $0.00000500 and actually hold there—especially with some strong daily closes and solid volume backing it up—we could see a move toward higher territory. In a bullish breakout, target zones would be somewhere between $0.00000600 and $0.00000650, which would mean gains of 25-45% from where we are now. Getting there would need a few things to line up: good volume, continued buzz from retail traders and maybe some institutional money, big holders not dumping on everyone, and decent overall market vibes.
Bearish Case & Key Risks
On the downside, things could get ugly if PEPE can’t defend the tight support zones. A break below roughly $0.00000450 might open the door to $0.00000430 or worse, especially if overleveraged longs get squeezed or bad macro news hits the market. Don’t forget the other risks lurking around: regulators could start causing problems, or the whole meme market hype could just evaporate overnight. After big early gains like we saw, speculative tokens often stretch too far and come crashing back down. Keep an eye out for cascading liquidations, retail traders losing interest, or whales quietly unloading their bags.
Strategic Guidance for Traders & Investors
For active traders, the sweet spot for entry would be a confirmed break above $0.00000500 backed by above-average volume. If you’re looking to nibble on a dip, consider scaling in around $0.00000450 near support—but keep your stops tight. For those thinking longer term, the growing holder count and active community are definitely positives, but you’ve got to balance that against the wild volatility and the fact that this is pure speculation. No matter which camp you’re in, keep your position sizes reasonable. PEPE has basically zero utility and carries massive risk as a meme token. Tracking open interest and sentiment in the derivatives market will help you spot when things might be getting too frothy.