Current Landscape & Market Sentiment
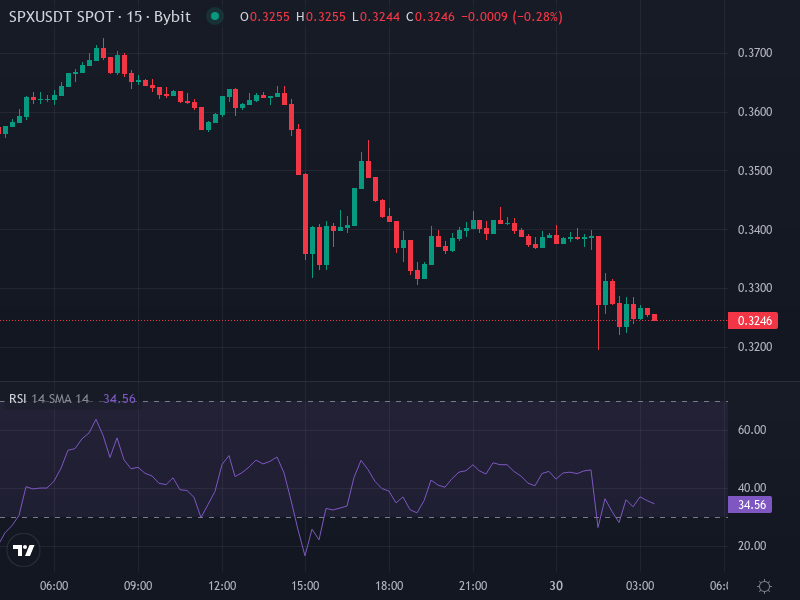
Right now, SPX6900 is sitting at around US$0.3245, down a painful -9.35% in just 24 hours. That’s a far cry from where it was earlier in the cycle—back when it was cruising above US$1.50 to US$2.20 in 2025. The drop seems to be fueled by a mix of macro jitters, fading hype on social media, and some big wallets quietly heading for the exits. Interestingly, while whale addresses (those holding 100M to 1B tokens) have mostly stabilized, smaller holders are still buying the dip. Meanwhile, derivatives activity and funding rates are hinting at short-term bearish pressure. There’s a growing disconnect between the die-hard community believers and the more cautious institutional players.
Sure, listings on Binance.US and Coinbase brought some buzz and liquidity, but those boosts didn’t stick around long enough to fight off the broader market turbulence. Without any new utility announcements or meaningful updates, SPX6900 is pretty much riding on vibes and meme magic at this point.
Technical Indicators & Structural Price Prediction
Looking at where the price is now and what the charts are telling us, there are a few important zones worth watching closely:
Key Support & Resistance Levels
There’s a crucial support zone hanging out around US$0.30 to US$0.35. This is where smaller investors have historically stepped in to buy. If the price drops below this range, things could get ugly fast—potentially sliding down to US$0.20. On the flip side, the first real wall of resistance sits at **US$0.50**, with an even tougher barrier in the **US$0.70 to US$1.00** zone. That upper range lines up with 2025 highs where sellers came out in force.
If SPX6900 can push back above US$0.50 and actually hold it, we might see some real momentum building toward that US$0.70 level. But if it can’t break through, expect more sideways action or even a drift back down to support.
Momentum, Volume & Trend Indicators
Momentum indicators have recently turned bearish—no surprise given the steep drop and lack of any higher highs forming. On-chain data shows growing open interest in derivatives, but funding rates are sitting around neutral or slightly negative, which means short-term traders aren’t exactly rushing to go long. Volume has dried up during this sell-off, suggesting people are losing interest rather than panic-selling. Unfortunately, there’s no bullish divergence showing up yet. We’d need to see indicators like RSI or TSI confirm oversold conditions and start trending upward before calling any kind of reversal.
One bright spot is that smaller and mid-sized wallets keep accumulating. If they continue buying while the whales take a break from dumping, it could create a floor that sets up for a bounce.
Price Forecast Scenarios
Based on what the technicals and data are showing, here are three realistic possibilities for SPX6900 over the next few weeks to months:
- Bearish scenario: The price can’t hold US$0.30, triggering a wave of stop-losses and pushing it down toward US$0.20 or lower. Negative funding rates and continued institutional selling pile on the pressure, leaving the coin stuck between US$0.15 and US$0.25 for a while before any real recovery can start.
- Neutral consolidation: SPX6900 trades sideways between US$0.30 and US$0.50. Support holds at the bottom, resistance caps any rallies at the top. Volume stays quiet, whales remain on the sidelines, and smaller holders keep slowly accumulating. Breaking above US$0.50 would probably need a fresh wave of social media excitement or a major new exchange listing.
- Bullish reversal: If the overall crypto market starts looking up and SPX6900 reclaims US$0.50 with solid volume behind it, a move toward US$0.70 becomes realistic. Momentum indicators would need to flip positive—think moving average crossovers or rising open interest. Getting all the way back to those earlier highs of US$1.50 to US$2.20 is possible, but it would take some serious narrative catalysts and sustained buying pressure to pull off.
Trends & Catalysts to Monitor
A few key things could really move the needle here: any new exchange listings or delistings, social media buzz and influencer shoutouts, what the whales are doing on-chain (especially if they start moving coins), derivatives market signals like open interest and long/short ratios, and bigger macro events—think interest rate decisions, regulatory news, and overall crypto market liquidity. Pay special attention to whether funding rates flip positive, as that would signal traders are getting bullish again.