Recent News & Market Context
The White Whale is a Solana-based memecoin that’s been turning heads lately with some pretty wild price action. We’re talking about a nearly 500× surge in less than a month, pushing its market cap to around $100 million. What really got people excited was the community takeover led by crypto influencer “@TheWhiteWhaleV2,” who took control of the treasury and promised to return creator revenues back to token holders. That move alone sparked a lot of renewed confidence after the project had been sitting idle for a while.
But let’s be real – it hasn’t been all smooth sailing. The token took a brutal 60% nosedive within a week after some whale dumped $1.3 million worth of tokens. That kind of sell-off sent shockwaves through the community, triggering panic selling among smaller traders and wiping out a ton of gains. It’s the classic memecoin rollercoaster that we’ve seen play out time and time again.
Looking at what the technical analysts are saying, the picture is pretty mixed right now. CoinCodex is leaning bearish for the next month, suggesting WHITEWHALE could drop around 25% and potentially hit $0.02621 by late February if the selling pressure keeps up.
Key Technical Indicator Analysis
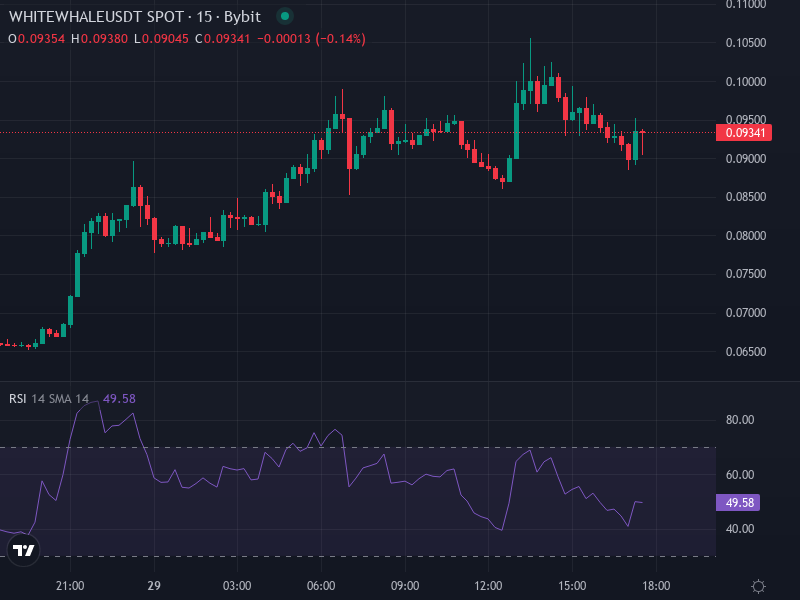
Right now, WHITEWHALE is trading around $0.09248 against USDT, and it looks like it’s sitting in a resistance zone. We’ve seen the $0.10 level act as a ceiling multiple times before – buyers just seem to run out of steam there. On the flip side, there’s some support hanging around the $0.07 to $0.08 range, though that might not hold if we see another wave of heavy selling. What’s interesting is that on-chain data shows early holders are still sitting on big bags, which means a few large players can really move the price around.
Moving Averages & Trend: The short-term moving averages, like the 50-day, are pointing downward and sitting above the current price – not a great sign if you’re hoping for a quick bounce. Even the longer-term averages are sloping down, which tells us that despite those explosive gains we saw, the token is still working through a correction phase.
Momentum Oscillators (RSI, MACD): During the surge, the RSI shot up into the high 90s – basically screaming “overbought.” That’s almost always a red flag that a pullback is coming. We did see some promising golden cross formations where shorter moving averages crossed above longer ones, but those signals got invalidated pretty quickly when the price crashed. Right now, there’s a divergence between price highs and momentum indicators that suggests the buying energy is fading.
Support & Resistance Thresholds
Resistance Zones: The $0.095 to $0.11 range is where sellers keep showing up. This zone has been a consistent ceiling where rallies tend to lose steam. If we can somehow break above $0.11 with solid volume backing it up, we might see a push toward $0.15 – but that’s definitely the optimistic scenario.
Support Zones: The first real support level is around $0.077. Below that, we’ve got stronger footing in the $0.05–$0.06 area. If things really go south and market sentiment tanks, we could see price test the $0.03 level where some buyers might step in to accumulate.
Price Predictions Based on Scenarios
Based on what the charts are telling us and how the market’s behaving, here are two likely scenarios:
Bearish Base Case (60–75% probability): Honestly, this seems like the more probable path right now. The token doesn’t have much real utility behind it, the indicators show it got way overbought, and those large holders can dump at any moment. We’re probably looking at a drift down toward $0.05–$0.06, especially if the broader memecoin market or Solana ecosystem hits some turbulence. If that $0.07 support level breaks, things could get ugly fast with $0.03 becoming the next stop. This could play out over the next couple of weeks to a month and a half.
Bullish Upside Case (25–40% probability): Now, if the community really rallies, we see some new exchange listings, and altcoins in general catch a bid, WHITEWHALE could surprise us and punch through that $0.11 resistance. We’d need to see consistent daily volume in the $20-30 million range along with genuine on-chain activity and buying pressure. If all those stars align, we might see a climb toward $0.15–$0.20 by mid-2026. But that’s a lot of “ifs” that need to line up perfectly.
Risk Factors & Indicators to Monitor Closely
If you’re thinking about trading this token, here’s what you absolutely need to keep an eye on:
- Whale movements – the big holders have already shown they can tank the price overnight with a single sell order, so watching their wallets is crucial.
- Volume patterns – is the price moving on real, sustained buying interest or just temporary hype spikes that fade quickly?
- The bigger picture – how’s Solana performing overall? What’s the general appetite for high-risk, volatile tokens in the market right now?
- Technical heat signals – RSI readings, Stochastic indicators, and those moving average crossovers have been pretty reliable warning signs for similar meme tokens in the past.
- Any actual developments – right now this is basically all narrative and social media buzz. Are there any real protocol upgrades or utility features in the pipeline?