Recent Context and Market Triggers
TOSHI, the memecoin running on the Base network, has been on quite the rollercoaster lately. Much of the wild price swings can be traced back to several centralized exchange listings and the broader meme coin mania that’s been sweeping through crypto markets. The big moment came when TOSHI landed on Upbit—one of South Korea’s heavyweight exchanges—with both KRW and USDT trading pairs. That announcement alone sent the price soaring more than 40% and pushed its market cap beyond $360 million. These exchange listings tend to work like rocket fuel, bringing in fresh liquidity and giving retail investors a renewed sense of confidence.
But it hasn’t been all sunshine and green candles. Technical indicators started waving red flags pretty quickly. TOSHI’s 14-day RSI recently plunged into seriously oversold territory, sitting somewhere in the low 20s. Stochastic oscillators and Williams %R backed up that bearish story, showing heavy downside pressure. To make matters worse, the 5-period and 10-period moving averages were hovering above the price, painting a rather gloomy short-to-mid-term picture.
Price Action & Technical Indicators at Present
Right now, TOSHI is trading at around $0.00029666 USDT, comfortably below the major resistance zones formed by recent swing highs. Both the 50-day and 200-day moving averages are sloping downward, which tells us the mid-to-long-term trend is still decidedly bearish.
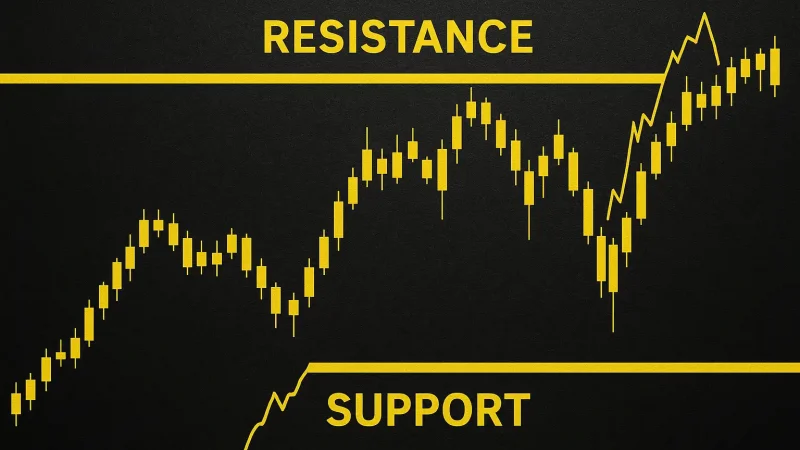
Looking at support, there are a few safety nets in place. The first comes in near $0.0002847, followed by another at $0.0002568. If things really go south, there’s a stronger foundation around $0.0002223. On the flip side, resistance starts showing up at $0.0003471, then builds higher at $0.0003817 and $0.0004095. Getting past those levels would be critical for bulls hoping to change the overall market structure.
Indicator Summary
• RSI (14): Deep in oversold territory, lingering in the low-20s—this screams potential for either a reversal or an overshoot.
• MACD: Pretty flat, maybe slightly negative—not much momentum here to confirm any kind of bounce just yet.
• Stochastic & Williams %R: Both are in oversold extremes, which typically suggests a relief rally could be on the horizon.
• Moving Averages: Price is sitting below short-, medium-, and long-term averages—classic bearish setup.
• Volume & Supply Signals: Coins are flowing out of exchanges, tightening available supply, while new listings are boosting visibility—both could act as bullish catalysts down the road.
Probable Scenarios and Projections
TOSHI seems to be catching its breath after the earlier surge, stuck in a consolidation zone. There’s real potential for a bounce here, but also a legitimate risk of sliding deeper if support gives way. Let’s break down the two most likely paths forward:
Optimistic Bounce Scenario: If that support around $0.0002847 manages to hold firm, we could see TOSHI climb back toward the first resistance at $0.0003471. From there, bulls might test $0.0003817. Breaking above the 50-day moving average would be a strong bullish signal and could open the door toward $0.0004095 or even higher—especially if trading volume picks up and exchange-driven demand keeps flowing in. Given how oversold the RSI and stochastic are, a bounce isn’t just possible—it’s actually pretty likely in the short to medium term.
Bearish Breakdown Scenario: On the other hand, if price punches through $0.0002847 with real conviction—backed by heavy selling—we’re probably headed down to $0.0002568, and possibly all the way to that stronger base at $0.0002223. Once that kind of bearish momentum kicks in, resistance levels become mostly irrelevant until broader market sentiment shifts or we get some positive macro news to turn things around.
Strategic Considerations for Traders & Investors
Let’s be honest—TOSHI is still a high-risk play. It’s a small-cap meme coin, which means volatility is baked into the cake. If you’re trading this, you’ll want to wait for confirmation: look for bullish reversal candlesticks near support zones, or watch for crossovers in the MACD or stochastic indicators. Volume is going to be the deciding factor here—without a solid uptick in trading activity, any bullish reversal is just noise.
For those holding longer term, keep an eye on platform exposure. More exchange listings increase the odds of wider adoption and sustained interest. But remember, if the broader altcoin and meme token markets hit turbulence, TOSHI won’t be immune. Pay attention to overall crypto sentiment, what’s happening in the Base ecosystem, and whether TOSHI can evolve beyond just being another meme—adding real utility would be a game-changer for its long-term prospects.