
Current Market Snapshot & Key Signals
Right now, Dogwifhat is trading at $0.34174598 against USDT, showing a modest gain of about 2.42% over the last 24 hours. Looking at the 4-hour chart, the Relative Strength Index (RSI) sits around 44.62, which tells us momentum is somewhere between mildly bearish and neutral—nothing too exciting either way. The MACD line is just barely above its signal line, with a tiny positive histogram of roughly 0.0018. That’s technically a bullish crossover, but honestly, it’s pretty weak. What’s more concerning is that price is still trading below both the 4-hour Simple and Exponential Moving Averages (around $0.354 and $0.352), meaning there’s resistance sitting right above us.
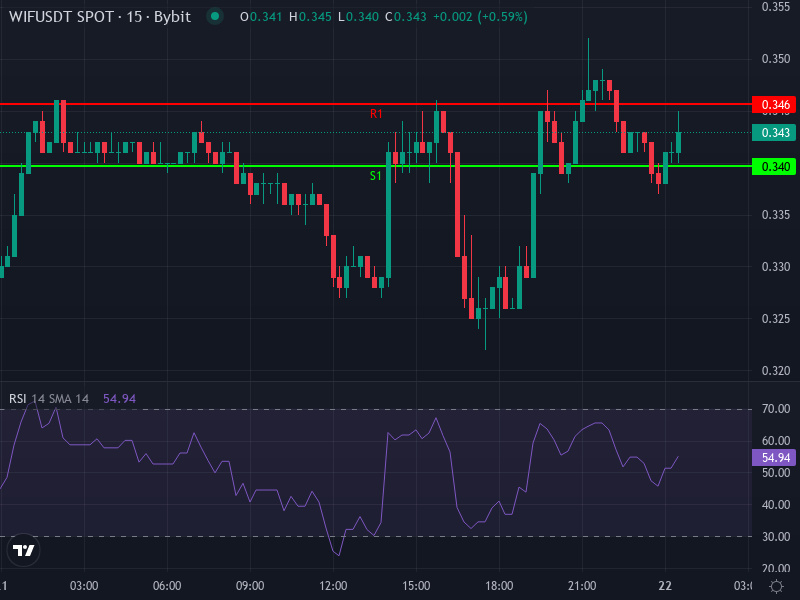
When we zoom out to the daily timeframe, the pivot point analysis shows immediate resistance at approximately $0.3456667 (R1), with additional barriers at R2 around $0.34833 and R3 near $0.35167. On the flip side, we’ve got support zones forming around $0.3396667 (S1), dropping down to S2 at roughly $0.33633 and S3 at $0.3336667. The one-day rate of change is actually negative, which means that despite those short-term gains we’re seeing, the overall momentum is still struggling.
What the Analysts & Community Are Saying
The projections floating around for Dogwifhat are all over the place, but most lean cautiously optimistic. A lot of technical analysts looking at 2025 expect WIF to find a comfortable range somewhere between $0.40 and $0.55 in the near term. The more bullish folks out there are throwing around longer-term targets between $2.00 and $3.50, though everyone agrees that hitting those numbers depends heavily on breaking through some serious resistance levels and getting that meme-coin hype train rolling again. There’s even one wave-count analysis suggesting that if we can break above $1.45, we might be looking at a run toward new all-time highs around $5.10. That’s a big “if” though—it would require a complete trend reversal and some serious volume. On the other hand, plenty of cautious voices are warning that dropping below $0.30 could lead to a long, painful consolidation period.
The community vibe around WIF tends to focus on its cultural appeal and relatively low supply compared to some other meme coins. Analysts frequently mention that Solana’s ecosystem—with its cheap gas fees and high transaction speeds—could really help WIF out. But there’s always that nagging concern: we’re bumping up against moving average resistance, there’s basically no utility beyond the branding and meme factor, and we really need both whale money and retail excitement to come back in a big way.
Technical Price Forecast Scenarios
Bullish Scenario
Here’s what could go right: If WIF manages to punch through that 4-hour resistance sitting around the $0.352–$0.354 moving average band—and does it with solid volume—we’d likely see it test that daily R1 level at $0.3457 first. From there, R2 around $0.3483 comes into play, potentially pushing toward R3 near $0.3517. Once we clear those hurdles, the psychological $0.40 level becomes the next obvious target. Looking out over the next several weeks, if everything lines up—market sentiment, social media buzz, maybe some positive Solana news—we could realistically see a rally toward $0.60 to $1.20 by mid-2025. The really aggressive bulls are even talking about $3.00 to $5.00 by year-end, but that would require everything to go absolutely right in terms of trend, volume, and overall sentiment.
Bearish / Sideways Risk
Now for the less fun scenario: If WIF can’t break through that $0.352 resistance and instead falls below the pivot support near $0.3397, we’re probably headed toward S2 around $0.3363 and S3 near $0.3337. A clean break below $0.33 would basically throw most of those bullish targets out the window and likely trap us in a boring range between $0.25 and $0.40 for a while. The technical indicators—low RSI readings and weakening MACD signals—would definitely start pointing bearish at that point, unless we get some surprise catalyst like a major exchange listing or an unexpected partnership announcement.
Key Levels & Indicators to Watch
• Resistance: $0.352–$0.355 (those 4-hour moving averages), then the $0.40 psychological level.
• Support: The pivot around $0.34, then the $0.33 zone.
• RSI: We need to see this climb back above 50 for any real bullish confirmation; anything below 30 means we’re oversold.
• MACD histogram: If this stays positive consistently, that’s your signal that the trend has legs.
• Volume: This is crucial—without volume picking up, any breakout attempts are probably going to fizzle out.
• Macro catalysts: Keep an eye on overall meme-coin sentiment, what’s happening in the Solana ecosystem, and any regulatory news.
Realistic Targets Based on Current Input
Starting from today’s price of around $0.342, here’s what seems reasonable under different scenarios:
– **Base case (neutral to mildly bullish):** $0.45-$0.60
– **Moderate bull run:** $1.00-$1.50
– **Strong breakout:** $2.00-$3.50+
– **Bearish outcome/invalidation level:** If we drop and stay below $0.30, we could be looking at $0.25 to $0.20, especially if market conditions get worse.
Concluding Insight
Dogwifhat is basically sitting at a fork in the road right now. From a technical standpoint, it’s stuck below some important moving averages and has multiple resistance levels to chew through before we can talk about a real uptrend. That said, the bullish potential is absolutely there if price manages to break overhead with real volume and community excitement behind it. For anyone holding or considering a position, the $0.34–$0.35 zone is everything right now: holding here could set up a nice recovery move, but failing here probably means more sideways action or worse. Those long-term targets in the $2-$5 range? They’re definitely possible, but we need a lot of things to fall into place first—both technically and sentiment-wise.