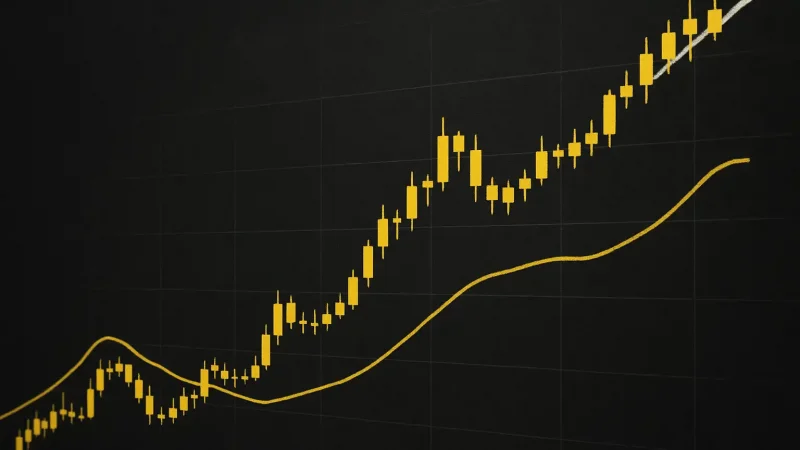
Current Market Snapshot & Recent Trends
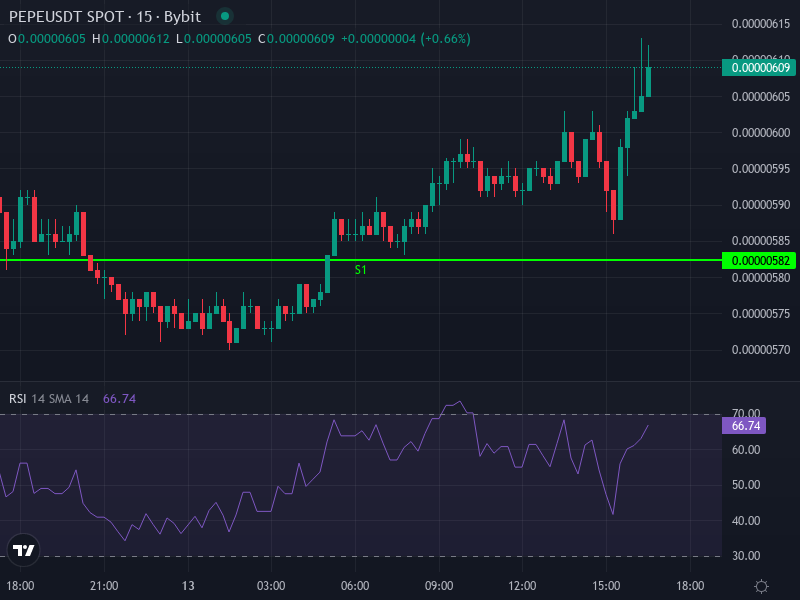
Right now, PEPE is trading at around 0.0000060822 USDT, up about 2.55% over the last 24 hours. It’s a decent little bump, though the technical picture is honestly pretty mixed when you zoom into the 4-hour chart. The RSI is sitting at roughly 56.4, which tells us things are leaning slightly bullish without being stretched or overheated. Meanwhile, the MACD is still trailing below its signal line, but the histogram just flipped positive—so we’re seeing early hints of momentum building, even if it’s not quite a full-blown reversal yet.
Looking at the moving averages, the 4-hour SMA is hovering around 0.0000059680, and the EMA is a touch higher at 0.0000059947. PEPE is trading just above these levels, which suggests it’s trying to stabilize and maybe push higher—assuming it can get past the next resistance without too much trouble.
Key Technical Zones & Resistance/Support Levels
When we zoom out to the daily chart, the pivot point sits at 0.0000059767 USDT. First resistance is up near 0.0000062533, with the second level at 0.0000064067. These are the zones bulls will need to crack to keep the momentum going. On the flip side, if things turn south, support kicks in at 0.0000058233, then deeper at 0.0000055467, and finally 0.0000053933 if sellers really take over.
With the MACD showing a fresh cross and RSI comfortably in the middle, there’s definitely room for PEPE to make a run at those resistance levels. That said, if it can’t stay above the pivot around 0.0000059767, we could easily see a dip back down to test support instead.
Short-Term Scenarios (Next 1-7 Days)
If things go well: Assuming PEPE holds above that daily pivot at around 0.0000059767 and buyers stay active, the first target would be up near 0.0000062533. Break through that, and we’re looking at 0.0000064067 next—a zone where previous resistance and some Fibonacci levels line up. Volume picking up or any positive news in the meme coin space would definitely help.
If things turn bearish: On the other hand, if PEPE slips below the pivot and loses support at 0.0000058233, the next stop would be around 0.0000055467. A breakdown there could push it down toward 0.0000053933, especially if the broader crypto market starts looking shaky.
Mid-Term Outlook (Next 4-12 Weeks)
Over the next few months, if the stars align and resistance zones get cleared convincingly, PEPE could potentially climb toward 0.0000080–0.0000100 USDT. Some forecast models even suggest a realistic shot at 0.000010 later in 2025, with more optimistic scenarios stretching up to 0.0000331 in a full-blown bull run. Of course, all of this hinges on sustained buying interest, general crypto market conditions, and whether PEPE can keep riding the meme coin wave without any real fundamental backing. If support levels fail to hold, though, we could see consolidation or a pullback toward the 0.0000055 area instead.
Influencing Factors & Key Risks
Let’s be real—PEPE is driven almost entirely by hype and sentiment. Community buzz, social media trends, and what’s hot in the meme coin space can send it soaring. But that same volatility makes it vulnerable to sudden sell-offs or when traders rotate into the next shiny new coin with better tokenomics or actual utility.
Liquidity is another thing to watch. There are likely some pretty thick sell walls sitting around those resistance zones near 0.00000625–0.00000640, which could stall upward moves. On-chain data like whale accumulation or big outflows will also play a big role. And don’t forget the external stuff—macro headwinds, regulatory news, or Bitcoin having a bad day can all weigh on PEPE’s price action.
Key Drivers to Watch
- Breaking above 0.0000062533 with solid volume would confirm a short-term bullish trend
- Losing the pivot at 0.0000059767 and slipping below 0.0000058233 could mean a bearish correction is coming
- RSI climbing above 70 on the 4-hour or daily chart could signal overbought conditions
- MACD showing divergence or a sell signal on higher timeframes might hint at a reversal
2025 Price Prediction & Long-Term Projections
Pulling together all the technical signals, meme coin trends, and where PEPE is sitting right now, a reasonable forecast for the end of 2025 puts PEPE somewhere around 0.0000080 to 0.0000100 USDT—assuming it clears resistance and holds support along the way. More optimistic scenarios, maybe driven by a fresh wave of meme coin mania, could push targets closer to 0.0000200–0.0000300 USDT, though those come with a lot more risk.
Looking further out to 2026 and beyond, a lot depends on whether PEPE can evolve beyond just being a meme. Without ecosystem growth or real utility, it’s hard to see massive gains holding long-term, especially with new meme coins popping up all the time. But even with conservative assumptions, PEPE could drift toward around 0.0000150–0.0000200 USDT by mid-2026 if bullish momentum sticks around.