Market Context and Recent News for Shiba Inu
Right now, as of January 13, 2026, Shiba Inu (SHIB/USDT) is sitting at around
$0.0000085928, up roughly 2.18% over the past 24 hours.
The meme-coin space has gotten pretty crowded lately, with newer tokens trying to steal the spotlight by promising better utility, governance features, and more aggressive tokenomics. You’ve probably heard buzz around projects like Little Pepe and DeepSnitch AI—they’re pulling capital away from SHIB, mostly by claiming they’ve got more room to run and flashier marketing campaigns.
That said, Shiba Inu isn’t standing still. The team’s been working hard on ecosystem upgrades, particularly around Shibarium, and they’ve ramped up token burns significantly. Exchange reserves are dropping too, which is generally a good sign. But let’s be honest—sentiment is still all over the place. People are worried about the massive supply, and we’re not seeing much institutional money flowing in yet. So SHIB is definitely feeling some pressure.
Technical Indicator Analysis: Short-Term and Mid-Term Signals
When we zoom into the 4-hour chart, here’s what the indicators are telling us:
- RSI (4h): hovering around 50.44 – pretty neutral territory. Not overbought, not oversold, just kind of… there.
- MACD (4h): The MACD line (around −4.65×10⁻⁸) is barely above the signal line (around −5.27×10⁻⁸). There’s a tiny positive histogram, hinting at some weak bullish momentum, but nothing to write home about yet.
- SMA/EMA (4h): The price is hanging just below the Simple Moving Average (about $0.0000086207) but really close to the Exponential Moving Average (roughly $0.0000085937). Basically, we’re seeing consolidation right around these levels.
Looking at the daily pivot points gives us a clearer picture of where price might head next:
- Pivot (daily): $0.0000085433 – we’re trading just above this level right now, which could mean a short-term bullish tilt if it holds.
- Resistance levels: R1 sits at $0.0000087167, R2 at $0.0000088333, and R3 up at $0.0000090067.
- Support levels: S1 is at $0.0000084267, S2 at $0.0000082533, and S3 down at $0.0000081367. The zone between $0.00000825 and $0.00000850 is really critical for near-term support.
We’re basically stuck in a tight range between the daily pivot and that first resistance above it. With indicators showing neutral-to-slightly-bullish vibes, the next big move—either a breakout or breakdown—should happen soon. We’ll need to see volume pick up to confirm whichever direction it goes.
Price Chart Visualization and Breakout Zones
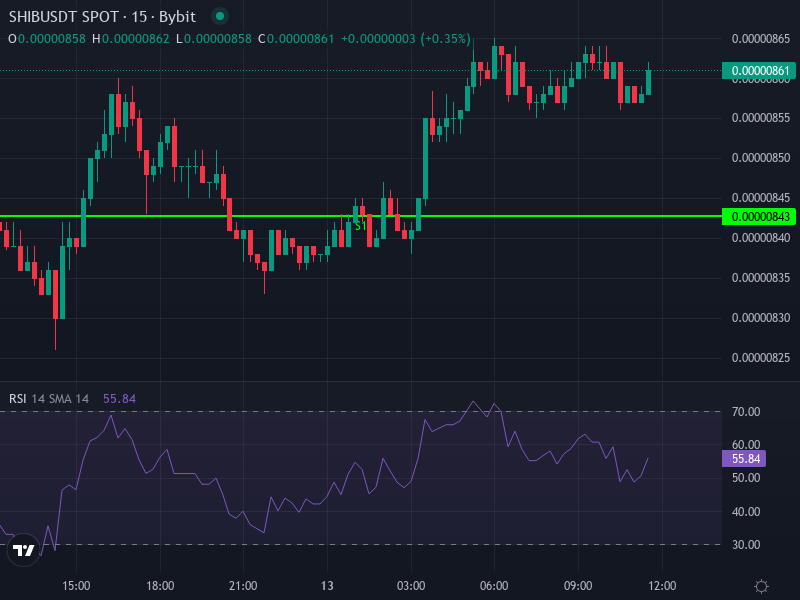
From what we can see on the chart, here are the zones that really matter:
- Upper resistance cluster: $0.00000870 to $0.00000900 – if we break through here convincingly, we could see a push toward those higher resistance targets.
- Lower support area: around $0.00000825 to $0.00000840 – losing this zone could trigger a quicker drop toward $0.00000800 or even lower.
- Pivot reaction: as long as we stay above that daily pivot around $0.0000085433, there’s a decent chance we could squeeze higher toward R1 and R2.
Mid-Term Scenarios: Bullish vs Bearish Paths
Bullish scenario: If SHIB manages to punch through $0.00000870 with solid volume backing it, we could see buyers pushing toward $0.00000890 to $0.00000910 pretty quickly. Get above $0.00000910 with momentum, and suddenly $0.00000950—maybe even $0.00001000—comes into play. For this to work, we’d need to see continued accumulation, more aggressive token burns, and real usage growth on Shibarium.
Bearish scenario: On the flip side, if support around $0.00000840 gives way, we’re probably heading back to test $0.00000825. Keep sliding from there, and breaking below $0.00000810 (that S3 level) could open the door to a deeper selloff toward $0.00000780 or worse. Watch for warning signs like RSI dropping under 30, MACD flipping decisively negative, or that daily pivot failing as support—any of those would make the bearish case stronger.
Price Predictions Based on Current Technicals and Market Conditions
Taking everything into account—the neutral-to-mildly-bullish RSI and MACD readings, our position near the daily pivot, and those resistance and support levels—SHIB looks like it’s consolidating with a slight lean toward upside over the next few weeks. If the stars align (volume spike, ecosystem news, burn acceleration), a realistic target sits somewhere between $0.00000900 and $0.00000950.
Looking out 1 to 3 months, if market conditions stay favorable and the utility side of SHIB keeps developing, we could be aiming for $0.00001000 to $0.00001200. But that’s a big “if”—we’d need clean technical breakouts, sustained momentum, and probably some help from the broader crypto market trending up. On the downside, if we hit macro headwinds, regulatory problems, or supply issues get worse, a pullback toward $0.00000780 is definitely on the table.
Key Indicators to Monitor Going Forward
Here’s what you should keep your eyes on:
- Volume spikes when we test resistance near $0.00000870 to $0.00000900 – that’s make-or-break for confirming a breakout.
- RSI movements, especially if it drops below 40 or climbs above 60—that’ll tell us if momentum is really building or fading.
- MACD crossovers on the daily chart, particularly when the signal line crosses above or below the MACD line.
- Token burn rate and exchange balance changes—actual supply pressure is what gives bullish stories legs.
- News about Shibarium updates, partnerships, regulatory developments, or competing tokens launching big presales that could steal attention.