Current Market Overview & Recent Developments
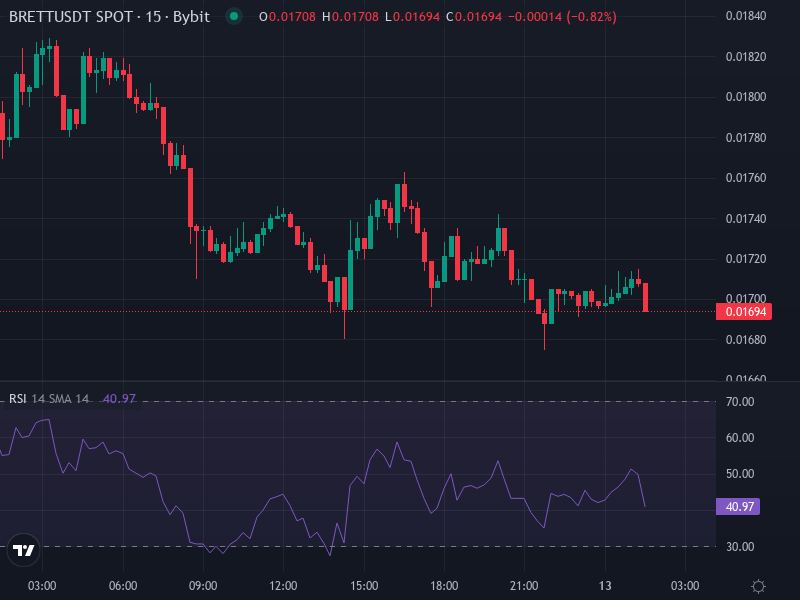
Right now, the meme coin BRETT (Based) is hovering around $0.01700 USDT, down roughly 4.09% over the last day. Trading has been pretty quiet lately, with not much volatility happening even though we’ve seen some other meme coins pumping recently. Looking at the technical picture, all 12 moving averages—everything from the 5-day up through the longer timeframes—are flashing bearish or strong sell signals, which tells us there’s consistent downward pressure building up.
The technical indicators aren’t looking much better either. The 14-day RSI is sitting at about 39, which leans toward selling pressure. Williams %R and CCI have both dropped into oversold territory, while the ADX shows the trend is losing steam. Pretty much all the momentum indicators like MACD, STOCH, and PSAR are showing negative alignment too.
As far as news goes, there hasn’t been anything major moving BRETT (Based) today specifically. But it’s worth mentioning there’s this separate presale project called “Layer Brett” that’s been getting a lot of buzz thanks to staking rewards and Ethereum Layer 2 scaling stuff, with people comparing it to big meme coins like SHIB and PEPE. This creates some awareness, but honestly, it also risks confusing investors who might mix up “BRETT (Based)” with “Layer Brett.”
Technical Indicators Deep Dive & Key Levels
Moving Averages & Momentum Signals
All the shorter and medium-term moving averages—from MA5 through MA50—are pointing bearish right now. The price is trading below these averages, which means the downward pressure is still pretty strong. Interestingly though, the longer-term moving averages like MA100 and MA200 are showing mixed to slightly bullish signals, suggesting there might be some support levels forming underneath the current price.
The momentum indicators paint a pretty grim picture overall. MACD is sitting neutral to negative, RSI at around 39 is firmly in “Sell” territory, and Williams %R and CCI have both plunged into oversold zones. The ADX shows moderate trend strength but isn’t signaling any bullish reversal yet. Bottom line: the bearish bias is dominating across the board.
Support, Resistance & Potential Reversal Zones
We’re probably looking at support zones somewhere around $0.0150–$0.0160, where those longer-term moving averages are coming together. On the flip side, immediate resistance is hanging out around $0.0185–$0.0190, marked by the previous MA50 and MA20 levels plus some recent swing highs. For sentiment to really shift toward neutral or bullish, we’d need to see a break above $0.0190 with decent volume backing it up.
If this weakness keeps going, we could be looking at downside targets around $0.0120–$0.0140 over the next few weeks. The oversold conditions suggest a bounce might be coming, but it would probably need some strong catalysts or a broader crypto market rebound to really materialize. Conservative traders should probably watch for price stabilization or bullish divergences in RSI or MACD as early warning signs.
Price Prediction Scenarios
Based on what we’re seeing right now, here are a couple of forecast scenarios for $BRETT/USDT over the next 1-4 weeks:
- Bearish Base Case: Price keeps drifting lower, probably retesting support around $0.0150–$0.0170, and potentially dropping to $0.0120 if volume doesn’t pick up. Moving averages stay above price, keeping resistance in place. There’s a risk of sharper drops if macro pressures get worse.
- Neutral to Mild Bull Case: Those oversold indicators could trigger a short-term bounce up to $0.0185–$0.0200, especially if we get better news flow or the broader crypto market rallies. Price might consolidate in the mid-$0.017–$0.020 range before trying to break higher.
What Could Flip Sentiment?
Here are some things that could shift BRETT (Based) from bearish to bullish:
- A strong reversal in the longer-term momentum indicators—especially if RSI starts diverging upward while MACD crosses over positively.
- Breaking above MA50 (around $0.0185) with sustained volume, confirming that resistance has turned into support.
- Positive project developments, like new exchange listings or community adoption events.
- Broader crypto market strength—think Bitcoin and Ethereum rallying—which typically lifts meme coins and other speculative plays.