Current Landscape and Catalyst Review
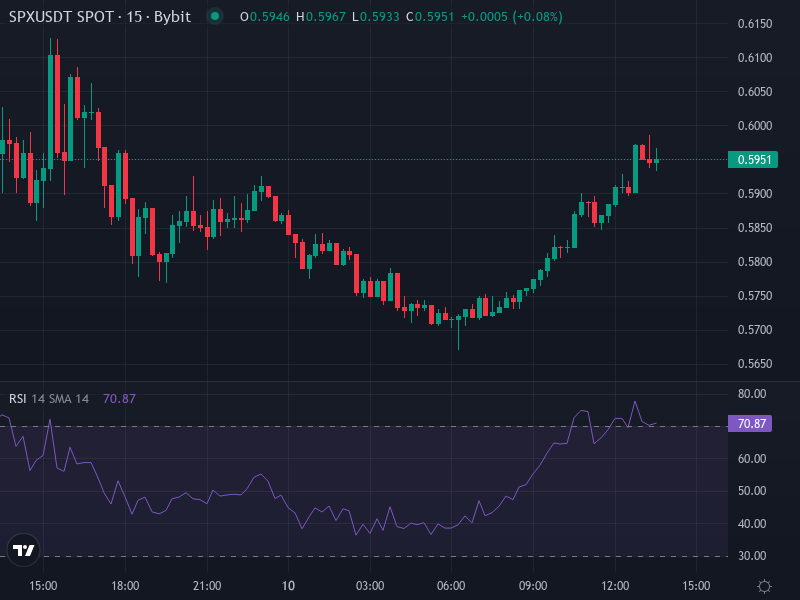
SPX6900 (SPX) is currently hovering around $0.5950, down nearly 46% in just the last 24 hours. It’s a brutal pullback after months of hype-fueled rallies, exchange listings, and the kind of meme-powered momentum that once pushed it as high as $2.85. But those explosive moves are looking harder and harder to repeat given the broader market environment we’re seeing right now. A couple of big moments have happened recently—like the Coinone listing in South Korea back in early January 2026, and a surge in Binance Futures activity that briefly pumped the token. Both of those events brought more eyes and liquidity to SPX, but they also brought new worries about over-leveraged positions and quick profit-taking from traders who got in early.
Technical Indicators and Price Action Breakdown
The recent collapse tells us that key support levels just couldn’t hold. We’d been watching the $1.50 mark as a kind of battleground—sometimes acting as resistance, sometimes as a bounce zone—but the drop from around $1.70 to $2.00 showed that sellers and short traders were getting aggressive. The real floor of the last major support zone was sitting somewhere between $0.70 and $0.80, and now that price has slipped below that, the chart structure looks pretty fragile. Momentum signals aren’t encouraging either: we’re seeing lower highs while open interest in derivatives keeps climbing, which usually means bearish pressure is building even if some smaller players are still trying to go long. Bull/Bear Power has flipped negative recently, and moving averages are probably starting to slope downward as price lingers below the 50-day line.
Volume is painting a cautious picture too. Spot trading has been pretty quiet compared to the action we’re seeing in derivatives, which tells you that a lot of traders are placing bets on volatility or using leverage rather than actually buying and holding the token with conviction. When spot volume dries up but derivatives explode, prices tend to whipsaw violently in both directions—and lately, those moves have been tilting to the downside. On-chain data shows that mid-sized whale wallets (holding 10 million to 100 million SPX) have been accumulating, but the bigger whales seem to be sitting tight or quietly heading for the exits.
Short-Term Projections (Next 1–2 Weeks)
Right now, the nearest resistance is sitting in that $0.70 to $0.80 range, with longer-term overhead at $1.10 to $1.30—both zones where price has gotten rejected before. If SPX can’t climb back above $0.70, we’re probably looking at support around $0.40 to $0.50, and if selling pressure really ramps up, there’s even a chance we could see a spike down toward $0.30. Indicators like the Relative Strength Index and Stochastic Oscillator are likely approaching oversold territory soon, which could trigger some short-term bounce attempts—especially if we get positive macro news or a broader rally in risk assets. But any bounce is probably going to be limited unless we see real spot liquidity return and bigger whales start buying again.
Medium-Term Outlook (3–6 Weeks and Beyond)
If SPX manages to find its footing above $0.80 and starts building real buying volume, the door could reopen toward that $1.10 to $1.40 range. But that’s a big “if.” It would take a combination of fresh retail interest, better macroeconomic data—especially around inflation and Producer Price Index numbers—and more listings on reputable exchanges. On the flip side, if SPX breaks cleanly below $0.40, we could be looking at a retest of the $0.20 to $0.30 area, which would be a serious blow to confidence. One thing to keep a close eye on is the Long/Short ratio in derivatives markets: if shorts stay dominant for too long, it’s going to be tough for any meaningful recovery to take hold.
Risk Factors and Key Monitors for SPX6900 Participants
Let’s be honest—volatility is sky-high here, spot liquidity is thin, and a lot of the price action is driven by speculation and narrative rather than fundamentals. Price swings tied to derivatives trading are way more dramatic than what you’d normally see with more established assets. Regulatory risk is real too, especially as more jurisdictions crack down on meme coins and speculative tokens. That could mean sudden delistings, restrictions on trading, or just a general chilling effect on volume. Exchange news matters a lot—stuff like the Coinone listing or rumors about potential Binance or Coinbase action can move the needle fast. And don’t sleep on the broader macro picture: inflation reports, central bank decisions, and overall risk sentiment can act as major catalysts in either direction.
From a technical standpoint, you’ll want to keep tabs on moving averages—especially the 20, 50, and 100-day lines—along with volume trends in spot versus derivatives, open interest changes, shifts in the long/short ratio, and any breaks of key support or resistance. If trend indicators like MACD cross into bearish territory below zero, or if the ADX starts signaling weakening momentum, those could be early warning signs that more pain is ahead.