Recent Noise & Ecosystem Catalysts
PENGU is sitting around $0.01197 right now, after climbing about 0.74% over the last day. The market’s feeling pretty indecisive, with some interesting developments creating both opportunities and headaches. The team’s Q1 2026 roadmap includes Pudgy Party Season 2, bringing fresh gameplay modes, new NFTs, and seasonal rewards—all stuff that could get more people using the token. There’s also a regulatory decision looming on March 11, 2026, about the Canary Capital hybrid ETF that combines PENGU tokens with NFTs. If that gets the green light, we might see some institutional money flowing in.
Beyond the crypto world, Pudgy Penguins has been making moves with things like the Kung Fu Panda partnership and getting their products into stores like Walmart. These deals help position PENGU as more than just another meme coin—there’s actually some utility here. That said, trading volume hasn’t exactly exploded lately, and the broader crypto market is dealing with regulatory uncertainty and general turbulence that’s keeping a lid on things.
Technical Analysis: Indicators & Key Price Zones
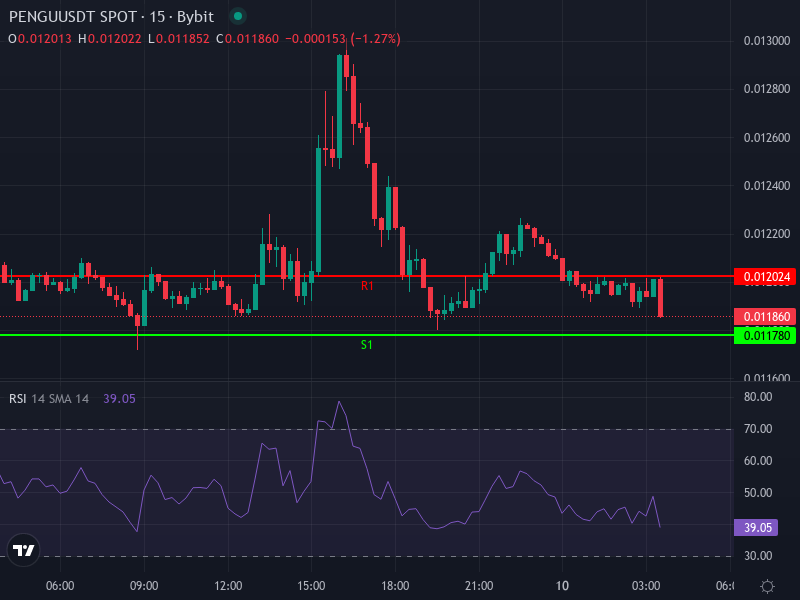
Looking at the 4-hour chart, PENGU’s technicals are pretty neutral with a slight bearish tilt. The RSI is hanging around 46.7, which means we’re in no man’s land—not overbought, not oversold. The MACD isn’t looking great either, sitting in negative territory with both the MACD line and histogram below the signal line, showing weak bearish momentum. The 4-hour Simple Moving Average is at about $0.01246, and the Exponential Moving Average is around $0.01207—both sitting above the current price, which means there’s resistance overhead. Basically, unless buyers really push hard above $0.01250, upside might be limited.
The daily pivot points show resistance clustered between $0.01192 and $0.01227, with support sitting at $0.01178, $0.01170, and $0.01154. Right now, the price is hovering near the daily pivot at $0.01194. Holding above that first support at $0.01178 is pretty important—lose that, and we could slide deeper. When you zoom out to longer timeframes, it’s a mixed bag: the shorter moving averages look bullish, but the 50- and 100-day averages are still above price, acting as ceiling.
Patterns & Divergences
On a more positive note, PENGU looks like it might be forming—or has already formed—a rounded or double-bottom pattern between $0.009 and $0.0115, where buyers have shown up before. These patterns often show up before a breakout happens. Also, on shorter timeframes, there’s a subtle bullish divergence: while the price made a lower low, the RSI and MACD are making higher lows. This suggests that even though the price dropped, sellers might be running out of steam.
Price Targets & Risk Thresholds
If buyers can push through the resistance around $0.0125-$0.0130 with solid volume behind it, we could see PENGU move toward $0.020. If something really big happens—like the ETF gets approved or there’s major news on the licensing front—and the overall market cooperates, there’s an outside chance of testing $0.035 or higher. But that’s a big if. On the flip side, if support around $0.0115–$0.0118 doesn’t hold, we could see PENGU drift down to the $0.0100 level, which is both a psychological barrier and technical support. Breaking below $0.009 would be a real red flag and could trigger more selling.