Current Market Context and Indicators
Right now, Brett (Based) — ticker BRETT/USDT is hovering around $0.01773, down about −1.16% over the last 24 hours. While it’s slipped a bit, the technical picture actually looks pretty interesting. There’s a decent chance we could see a bullish turnaround based on what the momentum signals, moving averages, and key price levels are telling us.
Looking at momentum, the 14-day Relative Strength Index (RSI) is sitting at around 55, which is basically neutral territory with a slight bullish lean. The Stochastic oscillator and Stochastic RSI are both showing overbought conditions, which usually means we might see some short-term pullbacks—but nothing that screams major reversal just yet. The Average Directional Index (ADX) is above 30, telling us the trend is actually getting stronger. Meanwhile, the MACD is flashing buy signals, though other oscillators like Williams %R and CCI are giving us mixed messages. Basically, there’s this tug-of-war happening between upside momentum and resistance that could trigger some retracements.
The moving averages paint an interesting picture too. Short-term averages like the MA5 and MA10 are trading above the current price, suggesting this recent dip might be testing support before bouncing back. The longer-term averages—MA50, MA100, and MA200—are still mostly above current levels, which means there’s quite a bit of resistance overhead. The way these averages are converging hints at a potential breakout zone, but it’s only going to happen if we see bullish volume come back into play.
Support levels are pretty clear-cut at around $0.0160, $0.0175, and $0.0186. These zones have held up during past pullbacks and could be where bulls regroup for another push higher. On the flip side, resistance is looking strong around $0.0211, $0.0225, and $0.0236. Breaking through these levels would be significant, but it’s going to take increased volume and positive market sentiment to make it happen.
Price Chart & Graphical Key Levels
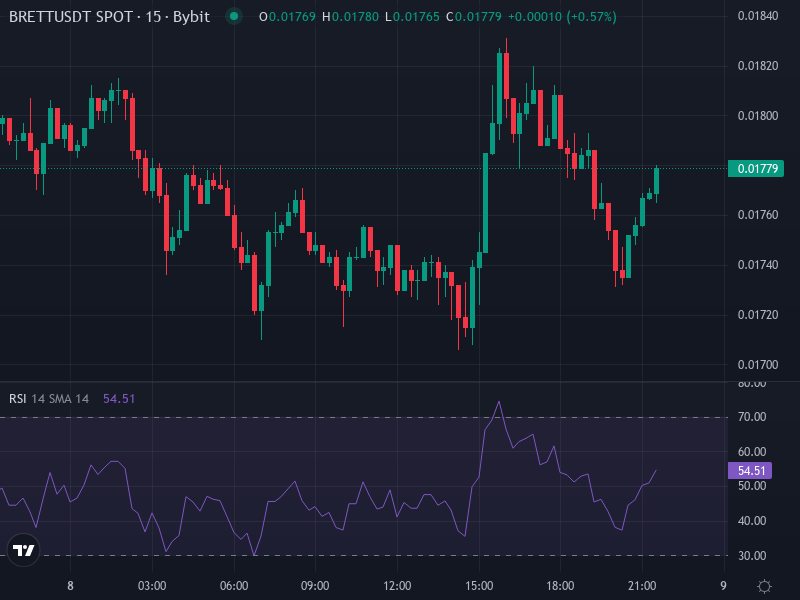
Forecast Scenarios & Price Projection
Bullish Case
If buyers show up at that strong support range between $0.0160 and $0.0185, and we get another surge in volume along with some positive market news, BRETT could realistically push toward the $0.0210–$0.0235 resistance zone within the next few weeks. A clean break above the MA50 and MA100 would really validate this scenario, potentially opening the door to test those psychological levels around $0.025–$0.030 if everything aligns. Things to watch for: MACD crossover, rising ROC (Rate of Change), and volume climbing with higher highs.
Bearish Case
On the other hand, if BRETT can’t hold above $0.0175, we could be looking at deeper drops toward $0.0150 or even down to the $0.013–$0.014 range. With those oscillators already overbought and the current downward pressure, there’s definitely a risk that sellers take control in the short term. If we fall below $0.0160, it could trigger a cascade of stop-losses, especially if the broader crypto market starts turning sour. Red flags to watch: ADX flattening or declining, and negative MACD slopes.
Mid-Term Outlook (1-3 Months)
Looking ahead over the next one to three months, if those support zones hold and the broader market conditions (think Bitcoin, Ethereum, overall macro trends) don’t fall apart, BRETT’s path is probably pointing upward. A recovery toward $0.025 and above seems totally reasonable if the bearish pressure eases up and investors start getting excited about potential catalysts—like new exchange listings, community growth, or DeFi partnerships. Keep an eye on these indicators: sustained above-average volume, RSI climbing toward 70 without staying extremely overbought for too long, and moving averages lining up properly with the short-term above medium-term above long-term. That said, if we break below that strongest support level, the mid-term outlook could shift bearish with targets around $0.010–$0.012 if sentiment really deteriorates.