Recent Developments & Market Sentiment
The meme-token “Cat in a Dogs World” (ticker MEW) has been on quite a rollercoaster lately. Right now, MEW is hovering around $0.0008697, which is down about 1.8% in the last day and a painful 28.9% over the past month. Daily trading volume sits at roughly $12.77 million—nothing to write home about for a token that’s seen better days.
The technical picture isn’t pretty either. Most analysts are calling this a strong downtrend. The price is stuck below both its 50-day and 200-day moving averages, the RSI is lingering in the low 30s (getting close to oversold territory), and volatility is sitting around 9% of the current price. Translation? Expect some wild swings in either direction.
Key Technical Indicators & Chart Levels
Support levels are becoming really important here. The lower Bollinger Band is pointing to support around $0.000736, which is just below where we’re trading now. On the flip side, resistance is stacking up at several levels: the 20-day moving average around $0.000968, the 50-day at roughly $0.00119-$0.00124, and a more stubborn resistance wall at about $0.0016.
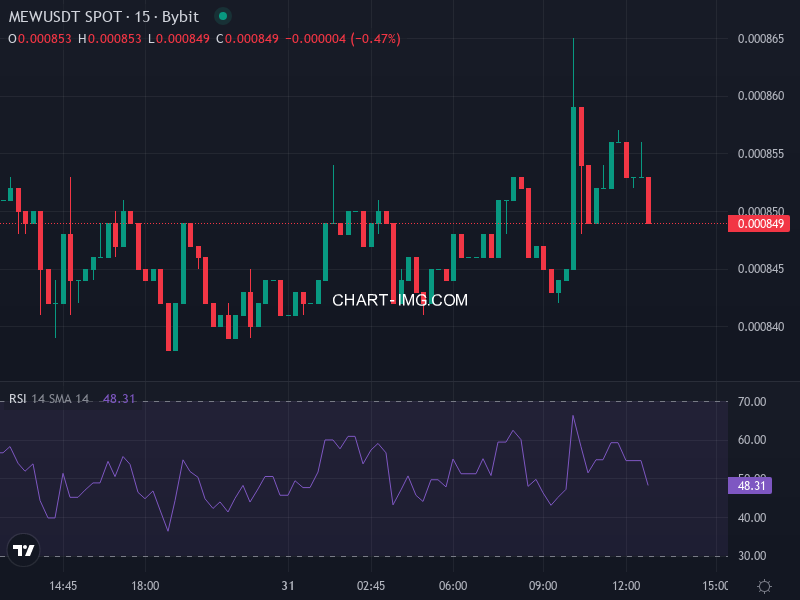
The momentum indicators are telling a similar story. The RSI at 31 suggests we’re getting close to oversold conditions, but the MACD is just kind of sitting there—not screaming “buy” or “sell.” The ADX has climbed above 50, which means the trend is strong, but unfortunately that trend is pointing down. Williams %R is deep in oversold territory, which sometimes hints at a potential bounce, but there’s no guarantee.
Volume & Momentum Signals
Trading volume has been pretty lackluster compared to the excitement we saw during the height of “cat season.” Remember when MEW fired off that massive green candle up to $0.01140? Yeah, those days feel like ancient history now. Without fresh volume coming in, it’s hard to see where the fuel for a rally would come from.
Price Prediction Scenarios & Risk Focus
Looking at the technicals and where we’re sitting today (around $0.00085166), here are a few ways this could play out as we head deeper into 2025.
Bearish Base Case: If MEW can’t push back above that $0.000968 to $0.00120 resistance zone, we’re probably heading lower. The next support cushion is somewhere between $0.00070 and $0.00075, and if that breaks, we could be looking at $0.00060 or worse—especially if Bitcoin and the broader crypto market start to wobble. Breaking below the lower Bollinger Band would likely accelerate the slide.
Bullish Reversal Case: For the bulls to take control, MEW needs to convincingly break above that 20-day moving average at $0.000968, and it needs to do it with serious volume behind it. If we can clear $0.00120 and hold it, that opens the door to the $0.00160–$0.00180 zone, which has been a stubborn ceiling in the past. We’d also need to see the MACD flip positive, RSI climb back above 50, and volume pick up significantly—basically, a complete mood shift.
Neutral / Consolidation Case: There’s also a decent chance MEW just trades sideways for a while, bouncing between $0.00075 and $0.00110 while everyone waits for something to happen. This would be the most frustrating scenario for traders—lots of choppy movement, fake-outs, and no real direction. If this is where we end up, risk management becomes everything.
Risk Alerts: Let’s be real—the downside risk here is significant. We’re well below the longer-term moving averages, volatility is high, and momentum is weak. Quick drops could happen without much warning if sentiment sours further. On the other hand, any surprise news—a new exchange listing, a partnership, or even just a meme going viral—could spark a sharp rally. But historically, these pumps tend to fizzle out fast unless there’s real substance backing them up.