Current State & Recent Developments
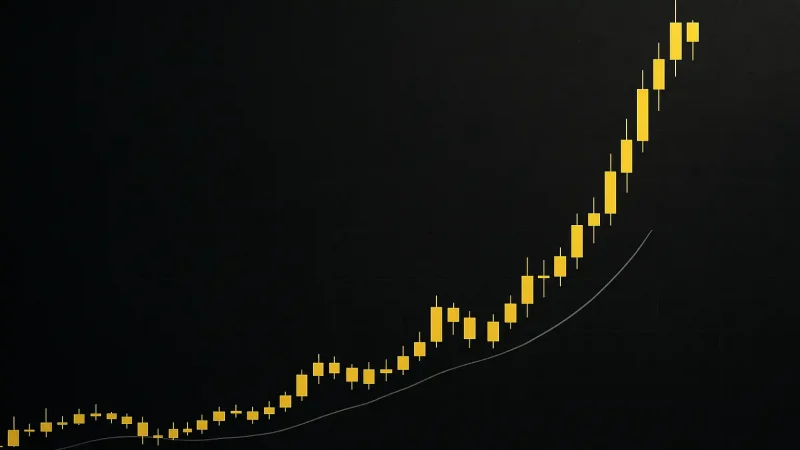
Cheems (CHEEMS/USDT) has taken quite a beating in the last 24 hours, dropping roughly 17.47%. Right now, the price is hovering around 0.000000988 USDT, which puts it below some pretty important moving averages—both short and medium-term. That’s usually a sign that sellers are in control. Looking at the charts, CHEEMS is trading under its 7-day and 30-day simple moving averages, sitting somewhere between 0.00000101 and 0.00000113 USDT. The 14-day Relative Strength Index is lingering in the low-40s, showing a sort of neutral but weakening vibe. Plus, the MACD histogram is showing negative values, which just adds to the bearish picture. All of this tells us that sellers are calling the shots unless something major comes along to flip the script. (Price change, averages & RSI/MACD readings sourced from mid- to late-December 2025 analysis).
When it comes to what’s actually happening with the project, Cheems is still very much a meme coin at heart. The Cheems Foundation launched around mid-2025 and has been focused on charitable stuff and cultural initiatives—things like donating to animal welfare organizations and boosting visibility through merch and media. These are great for building community loyalty, but they haven’t really translated into actual utility or revenue for the token itself. Without things like token burns, staking rewards, or other protocol incentives, CHEEMS is pretty exposed to whatever mood the broader market is in and how liquidity flows around.
Technical Indicators & Key Levels
Moving Averages: The 50-day SMA is currently acting like a ceiling—every time the price tries to push through, it gets knocked back down. The 200-day SMA is also sitting above the current price, creating another barrier that reinforces the downtrend. If the price can actually break above both of these, it would suggest things might be turning bullish.
RSI & MACD: The RSI is sitting around 38-43, which means CHEEMS isn’t deeply oversold or overbought—it’s kind of in limbo, but leaning downward. The MACD histogram is still negative, telling us that momentum is with the sellers right now. For things to turn around, we’d need to see the MACD cross above its signal line and the RSI climb above 50.
Fibonacci & Support/Resistance Levels: If you look at Fibonacci retracements from recent highs and lows, the main resistance zones bunch up near those SMA levels we talked about—roughly 0.00000105-0.00000120 USDT. On the flip side, there’s solid support just below where we are now, around 0.00000098-0.00000100 USDT. If the price falls through that support, we could see it drop toward previous lows. But if it breaks cleanly above resistance, we might see a move toward 0.00000120 or even higher.
Volume and Market Sentiment
Trading volume has been pretty quiet lately, which makes any potential breakout less convincing. There’s a general sense of risk aversion in the altcoin space right now—Bitcoin’s dominance is around 59%, which means money is flowing toward what people see as safer bets. Meme coins like CHEEMS usually get hit hard in these conditions because they don’t have much liquidity and rely heavily on speculation. Without strong volume or some kind of positive catalyst, any price bounce is probably going to be weak and short-lived.
Price Prediction Scenarios
Bearish Base Case: If CHEEMS can’t get back above the 7-day SMA (around 0.00000101–0.00000103 USDT), we’re probably looking at a slide toward support near 0.00000095 USDT. If that support breaks, things could get ugly fast, potentially dropping toward yearly lows around 0.00000088–0.00000090 USDT. This becomes more likely if Bitcoin and other major coins start falling and the overall market stays risk-averse.
Neutral / Moderate Upside Case: If CHEEMS manages to climb above those short-term SMAs with decent volume backing it up, we could see a bounce toward 0.00000115 USDT, which is a mid-term resistance level. Getting above the 30-day SMA (around 0.00000113 USDT) would open the door to potentially reaching 0.00000120-0.00000130 USDT, though staying above that might be tough without some real utility or demand driving the price.
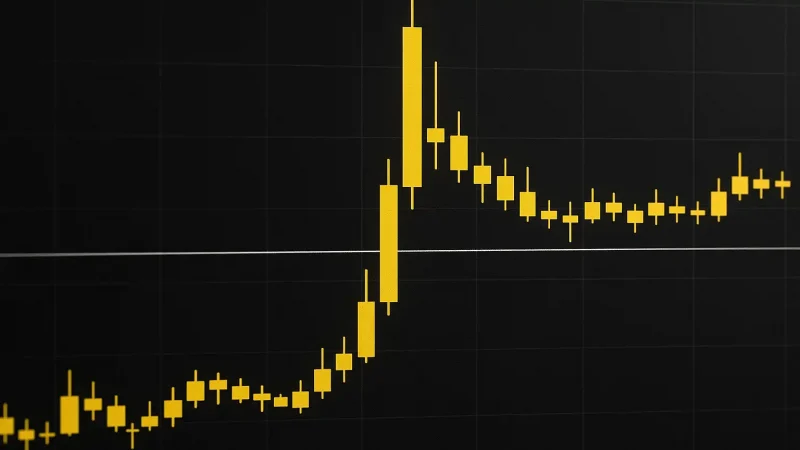
Bullish Bull Trap Case: There’s always a chance CHEEMS could suddenly spike—maybe from meme hype or social media buzz—and try to test resistance around 0.00000140-0.00000150 USDT. But honestly, this looks a lot like past meme rallies: quick rise, shaky foundation. Without serious volume behind it, these pumps tend to reverse just as quickly as they started.
What to Watch
Keep an eye on a few key things. First, watch for the MACD to form a bullish crossover, where the MACD line goes above the signal line. Second, if RSI climbs above 50 along with a spike in volume, that would signal growing bullish interest. Third, a convincing break above the 50-day SMA could mark a real turning point. And finally, any external news—like announcements from the Cheems Foundation, actual utility upgrades, or major community milestones—could shift sentiment pretty dramatically.