Current Market Signals and News Overview
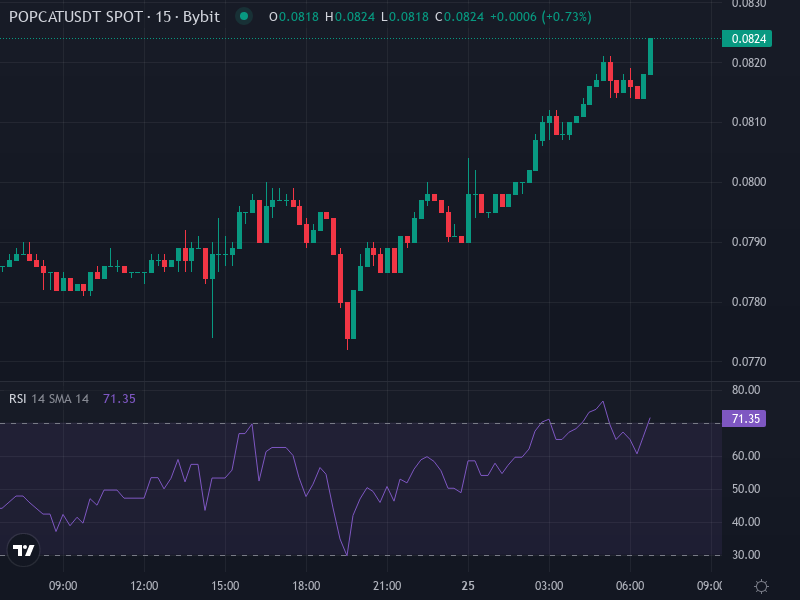
Right now, Popcat on Solana is trading at around $0.0823 USDT, with a pretty decent 24-hour bump of about +4.94%. While that sounds encouraging on the surface, there’s more to the story. Recent technical analysis shows that even though we’re seeing some bullish movement, the token is still facing some serious headwinds. The price is sitting below both its 50-day and 200-day simple moving averages—which basically tells us that the medium and long-term trends aren’t looking great yet. Most technical indicators are leaning bearish, suggesting there’s more downside risk than upside potential at this point. Traders are keeping a close eye on support around $0.08, with a stronger base somewhere between $0.07 and $0.09. On the flip side, resistance is stacking up around $0.10 to $0.12, and POPCAT needs to push through those levels before we can talk about any real upward momentum.
What’s happening behind the scenes is equally interesting—and a bit concerning. There’s been increased activity from large wallets, or “whales,” but that hasn’t exactly inspired confidence among regular buyers. Some troubling reports have surfaced about a manipulation scheme involving USDC transactions and liquidity issues on the Hyperliquid exchange, which has definitely shaken trust in the market. Technical analysts are laser-focused on the $0.14 level right now. That’s being called a make-or-break resistance point—if POPCAT can punch through decisively, it could really shift the sentiment from bearish to bullish.
Technical Indicators & Short-to-Mid-Term Price Projections
Let’s dig into what the charts are actually telling us. The Relative Strength Index is hanging out in neutral-to-slightly-bearish territory, typically hovering somewhere in the mid-30s to low 40s. That’s not terrible news—it means there’s still room for the price to drop further before we hit oversold levels where buyers might step back in. The MACD indicator has shown a weak bullish crossover on some timeframes, but honestly, it’s not very convincing. Low volume and the price staying stubbornly below those key moving averages make it hard to get excited about that signal.
So where are the critical levels? Immediate support looks solid around $0.08, but if things get choppy, we could see the price test the $0.07 to $0.06 range pretty quickly. Resistance is clearly marked between $0.10 and $0.12—breaking through there would require a serious surge in buying volume and conviction from traders. Based on various forecasting models that factor in historical volatility and blockchain data, the outlook for January through March 2026 suggests POPCAT could trade anywhere from $0.06 to $0.09 if we stay in bearish-to-neutral conditions.
Scenarios to Watch
Bullish Trigger: Here’s what needs to happen for the bulls to take control—POPCAT has to close decisively above $0.12 with strong volume backing it up. If it can hold that level, we could realistically see a push toward $0.15 or even $0.20. But that’s a big “if”—it would require breaking through seller resistance and a genuine shift in market sentiment and technical momentum.
Bearish Trapdoor: On the downside, if support at $0.08 fails to hold, things could get ugly fast. The next stop would be around $0.07, and if that breaks, we’re looking at $0.05 or lower. A drop below $0.05 could trigger a cascade of stop-losses, especially in low-liquidity zones where price moves can get exaggerated quickly.
Expectations for Longer Term and Strategic Takeaways
Looking further down the road—say one to three years out—the picture is pretty mixed. Some neutral-to-mildly-bullish forecasts suggest POPCAT could gradually climb to around $0.10 to $0.12 by 2028 or 2030, assuming the broader crypto market stays relatively stable and the project continues to engage its community with updates. But there are plenty of bearish scenarios too. Without stronger fundamentals or meaningful development on the blockchain side, the token could easily get stuck below resistance levels or even lose value over time.
If you’re trading or investing in POPCAT, there are three things you absolutely need to watch. First, volume patterns—a sustained spike in daily trading volume could validate any bullish setups and signal real momentum. Second, how the price behaves around that $0.10 to $0.12 resistance zone is crucial. And third, keep an eye on overall market risk appetite, because meme coins like POPCAT are incredibly sensitive to narrative-driven swings. A single viral tweet or piece of news—positive or negative—can send prices moving dramatically. Bottom line: proper position sizing and solid risk management aren’t optional here—they’re essential.