Current Market Context & Recent News
ApeCoin is currently trading at around $0.2013, down about 1.81% over the past 24 hours. If we’re being honest, the past few weeks haven’t been kind to APE holders—most technical indicators are flashing bearish signals. The coin has been consistently stuck below its MA-20, MA-50, and MA-200 levels, which basically means sellers have had the upper hand for a while now. In one recent snapshot, APE was sitting at $0.2398 but couldn’t break past its MA-20 at roughly $0.2712, with the MA-50 around $0.3458 and MA-200 way up at $0.5395. That’s a lot of resistance overhead on pretty much every timeframe you look at.
On the fundamental side, things are a bit of a mixed bag. The good news? APE has hit oversold territory a few times, leading to some quick bounces, and there’s been some positive movement on the ecosystem front—integrations into new chains and improved staking rewards could provide some fuel down the road. The not-so-good news? On-chain activity remains pretty sluggish, and APE is still trading way below its historical averages, which continues to drag on sentiment.
Technical Indicators & Key Levels
Let’s dig into what the charts are telling us right now, looking at both four-hour and daily timeframes:
- RSI (4-hour): Sitting at about 44.3, which is just a hair below the neutral 50 mark. This tells us momentum is pretty weak and there’s a slight lean toward the downside, though nothing extreme.
- MACD (4-hour): The MACD line is at −0.0021747, barely under the signal line at −0.0021785, with an almost negligible positive histogram. Translation? It’s basically neutral with a tiny bearish tilt—not screaming anything definitive either way.
- SMA & EMA (4-hour): The simple moving average is hovering near $0.20306, while the exponential moving average is slightly higher at around $0.20529. Since the current price is below both, it’s another sign that sellers are still calling the shots in the short term.
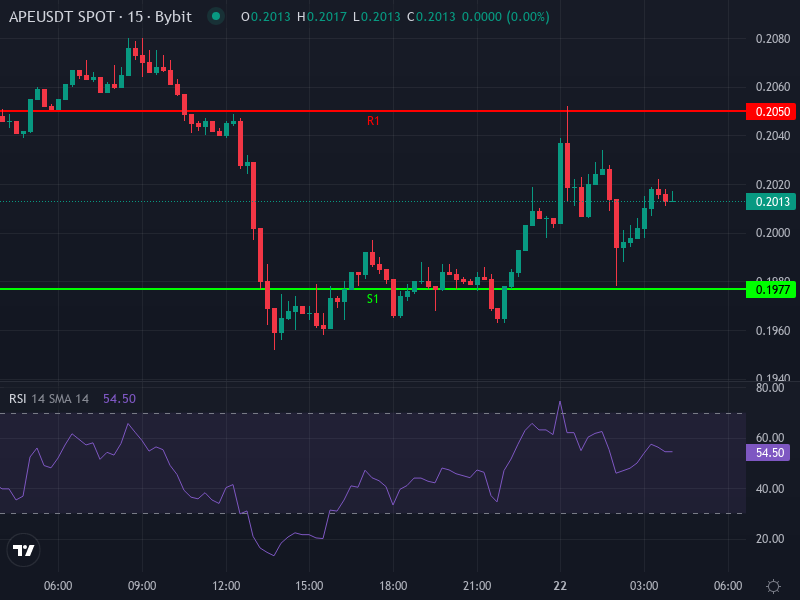
- Pivot Points (daily): We’ve got resistance levels at R1 around $0.2050, R2 at $0.2087, and R3 at $0.2123. On the support side, S1 sits at $0.1977, S2 at $0.1941, and S3 at $0.1904. Right now, APE is dancing dangerously close to that first support level, and if selling keeps up, we could see those lower supports tested pretty quickly.
Support & Resistance Zones
- Immediate resistance: The $0.2050 to $0.2085 zone is where APE needs to prove itself. This area lines up with pivot R1 and those 4-hour moving averages. If buyers can push through here convincingly, we might see some upside momentum toward the $0.212 to $0.214 range.
- Immediate support: The first real test is at $0.1977 (that S1 pivot), with backup support at $0.1941 and $0.1904 further down. If APE breaks below $0.195, things could get ugly fast, potentially heading down toward the $0.180 to $0.190 zone.
Short-Term & Medium-Term Price Prediction
So where does APE go from here? Let’s break down a few realistic scenarios for the coming days and weeks:
- Bearish baseline: If APE keeps bumping its head against that $0.205 to $0.208 ceiling and can’t break through, we’re probably looking at a test of that $0.1904 support level. And if the broader crypto market catches a cold or macro conditions worsen, we could easily see a drop toward $0.180. The weak MACD and those stubborn resistance levels aren’t doing bulls any favors right now.
- Neutral/consolidation scenario: Honestly, this feels like the most probable outcome in the near term—APE just grinding sideways between roughly $0.190 and $0.210. This range captures those key pivot supports and resistance zones, which makes sense given there’s not much in the way of strong catalysts pushing price decisively in either direction.
- Bullish reversal scenario: Now, if APE manages to punch through resistance at $0.2087 to $0.2123, especially with RSI climbing back above 50 and MACD flipping positive (that signal line crossover traders love), we could see a nice run toward $0.228 to $0.240. But let’s be real—this would need some kind of catalyst, whether that’s good news on the ecosystem front or a broader crypto market rally. Without that spark, this scenario remains more wishful thinking than likely outcome.
Final Insight — Risk & Opportunity
APE is clearly under some pressure here. It’s trading below all its major moving averages, MACD is looking weak, and RSI is just meh. That said, we’ve seen those oversold bounces, and there are some potentially supportive developments happening with staking and integrations that could provide some lift. If you’re thinking about getting in, watch for entry points near that $0.190 to $0.195 support zone, but keep a close eye on resistance between $0.205 and $0.212. A breakdown below support could accelerate losses pretty quickly, but there’s definitely structure here for a modest rebound if resistance gets cleared. Bottom line? This isn’t an environment for complacency—tight risk management is absolutely essential given the prevailing bearish vibes.