
Market Context & Recent Price Action
Mog Coin (MOG) is currently trading around $0.00000024105 USDT, down roughly 4.1% over the past 24 hours. The token sits at a market cap of approximately $99.4 million, with daily trading volume hovering near $7.1 million. This suggests there’s still decent liquidity and interest, though not exactly explosive. Volume has taken a bit of a hit lately, but that’s pretty typical for meme coins when the broader market gets jittery. Like most tokens in this category, MOG tends to move in sync with wider meme-coin trends and responds quickly when risk appetite shifts in either direction.
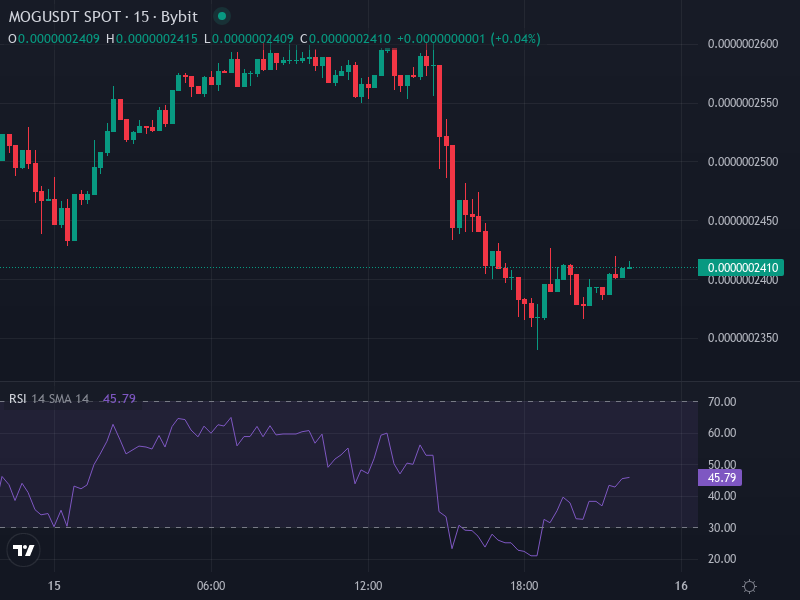
Looking at the technical picture, we’re seeing mixed signals across the board. Short to medium-term moving averages are showing some bullish tendencies, but momentum indicators like RSI and Williams %R aren’t exactly confirming that enthusiasm. This disconnect usually means the market is consolidating rather than gearing up for a big move in either direction. Traders seem to be sitting on their hands, waiting for something to tip the scales.
Technical Indicators & Key Support / Resistance Zones
When we dig into the standard technical indicators, here’s what stands out:
- Relative Strength Index (RSI 14): Currently bouncing around between 38–58, which puts us somewhere between mildly oversold and completely neutral territory. Not screaming anything definitive either way.
- Moving Averages (MA20–MA100): The medium-term averages like the 50-day and 100-day are sloping upward, which is generally a positive sign. However, the shorter moving averages are still pretty flat or even slightly negative, so there’s no clear consensus yet.
- ADX (Average Directional Index): This one’s elevated, which tells us that when price does pick a direction, it’ll likely move with some conviction. The problem is, it’s not telling us which direction that’ll be.
- Williams %R, Stochastic / StochRSI: We’re seeing some overbought readings pop up here and there, but they’ve been reverting quickly. Translation: pullbacks are still very much in play.
Here are the levels worth watching closely:
- Support levels: The main support zone sits around $0.0000000626 USDT, with a tighter range between roughly $0.0000000624-0.0000000628. These levels have held up during recent consolidation, so they’re worth respecting.
- Resistance levels: In the short term, look for resistance around $0.0000000630-0.0000000632 USDT. If MOG can push through there, the next meaningful barrier is up around $0.0000000635. Breaking cleanly above that zone would be the first real sign that bulls are taking control.
Short-Term Forecast & Trading Scenarios
Bullish Case
If MOG manages to break through resistance in the $0.0000000630–$0.0000000635 range with solid volume backing it up, we could see a push toward $0.0000000700. This becomes even more likely if we get positive macro developments—think regulatory clarity, new exchange listings, or a fresh wave of meme-coin hype. The elevated ADX suggests that if this breakout happens, it could have some legs and run for multiple sessions. The key would be holding support levels first and waiting for that volume confirmation before jumping in.
Bearish or Sideways Case
On the flip side, if MOG can’t punch through resistance and volume stays weak, we’re probably heading back down to test support around $0.0000000624–0.0000000626 USDT. If that level gives way, things could get ugly fast, with a slide toward $0.000000058–$0.000000060 looking increasingly likely. Momentum indicators are flashing warnings that downside pressure could build if buyers don’t show up to defend these zones. Risk-reward isn’t particularly attractive here unless we get a clear signal.
Neutral / Wait-for-Signal Strategy
Given how mixed everything is right now, the smart play might be sitting tight until we get clearer confirmation. Wait for either a clean break above resistance or a solid bounce off support before putting capital at risk. Watching for key moving average crossovers—like the 50-day crossing above the 100-day—could also provide better entry points. If you do go long, keep stops just below support, and be ready to take profits if momentum starts fading on the way up.