Recent Developments & Market Sentiment
The memecoin landscape keeps evolving at breakneck speed. BOOK OF MEME (BOME), built on Solana, has caught attention lately as big wallets started accumulating again after the recent crypto market pullback. We’re seeing whale wallets scooping up BOME alongside other Solana meme favorites like SLERF and BODEN, which tells us there’s still speculative appetite during these dips. This kind of behavior usually means the big players are betting BOME could pop if the overall market mood lightens up.
Looking at what BOME actually offers, the tokenomics are worth noting. There’s about 69 billion tokens total—half went to presale buyers, 30% sits in liquidity pools, and 20% is earmarked for the community. The project’s hook is preserving meme culture using decentralized storage solutions like Arweave and IPFS, basically creating a digital archive for memes on the blockchain.
Technical Data & Indicator Analysis
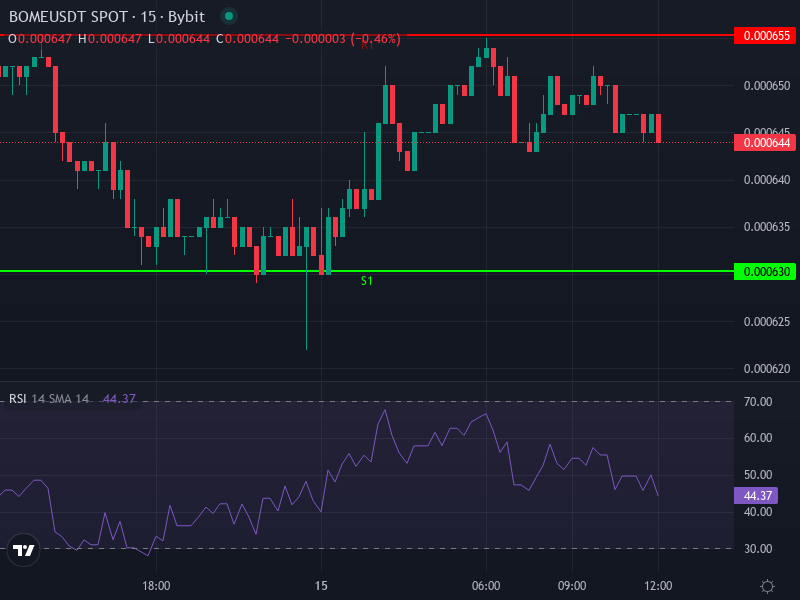
Right now, BOOK OF MEME is trading around $0.00064506, down slightly over the past day. If you look at the daily chart, there’s a pretty aggressive bearish engulfing candle that formed right after a brief pop toward $0.000766. Resistance is stacking up around $0.000755–$0.000766, while the nearest support cushion sits between $0.000669–$0.000672, which lines up nicely with the 61.8% Fibonacci retracement level.
Zooming into the 4-hour chart, the RSI is hovering around 39—that’s mildly bearish territory, but not catastrophically oversold. There’s room for a bounce if selling pressure eases up. The MACD is showing a tiny bit of negative divergence here, with the MACD line just under its signal line and the histogram barely in the red. Both the Simple and Exponential Moving Averages on the 4-hour are sitting above price—SMA at roughly $0.0006722 and EMA at about $0.0006700—which means they’re acting as overhead resistance right now.
Moving Averages & Oscillators
The moving average picture is mixed. Shorter-term MAs like the 5-day and 10-day are flashing buy signals, but the 50-day and 100-day are still pointing toward more selling pressure. The daily RSI (14) is sitting around 52—basically neutral ground. The ADX suggests the trend strength is fading. Some oscillators like CCI and ROC are leaning slightly bullish, but Williams %R and other quick-reaction indicators are warning that any rally attempt might run out of steam fast.
Price Projection Scenarios & Key Levels
Based on what the charts and indicators are telling us right now, here are the most realistic scenarios playing out for BOME in the coming weeks and months.
- Bearish Base Case: If sellers manage to crack through that support cluster around $0.000669–$0.000672 with conviction, we’re probably looking at a test of the $0.000600-$0.000620 zone, especially if volume starts drying up. Break below that, and we could see $0.000500 come into play as the next serious floor.
- Neutral / Accumulation Phase: There’s a decent chance price just chops sideways between roughly $0.000650 and $0.000755 for a while. Consolidation tends to happen when there’s no clear catalyst either way—no major crypto rally, no big exchange listings, no fresh memecoin mania. Traders in this scenario would likely buy the dips near the bottom and sell into strength at the top of the range.
- Bullish Upside: If BOME can punch through resistance at $0.000766 with real volume behind it, the next target zone would be around $0.000900. From there, if momentum actually sticks, we could see $0.00110-$0.00125 come into view. Getting there would need a genuine shift in sentiment—maybe some viral social media moment, positive news, or a broader crypto market surge.
Keep an eye on these resistance zones: $0.000755, $0.000800, then $0.001000. On the support side: $0.000669, $0.000620, and then down around $0.000500 if things get ugly.
Here’s what looks reasonable across different time horizons:
- Next 1-2 weeks: probably bouncing around between $0.000620 and $0.000700, depending on whether support holds.
- 1-3 months out: if accumulation keeps happening and markets calm down, we could retest $0.000800-$0.001000. But if volatility stays high, drifting down toward $0.000500 wouldn’t be shocking.
- 12-month view: this one’s really tough to call. It depends heavily on whether the community stays engaged, whether the ecosystem grows, and where we are in the memecoin hype cycle. Best case, you could see massive percentage gains from here; worst case, it just bleeds out slowly or goes nowhere.
Risks & Catalysts Influencing Path Forward
Potential Catalysts: A fresh wave of social media buzz, influencer shoutouts, getting listed on bigger exchanges, or actual traction with the meme-NFT archive angle could all boost visibility. The fact that whales are buying at these levels suggests they think there’s upside potential. If the team can deliver on the cultural preservation mission with some real execution, that might resonate beyond just degen traders.
Major Risks: Memecoin fatigue is real—retail traders are getting burned out. Regulatory risk is always lurking, especially around how presales were handled and token distribution. There’s also the ever-present danger that early whales could dump their bags. It’s worth remembering that BOME’s all-time high was around $0.02805, meaning it’s down roughly 97-98% from peak. That kind of drawdown means anyone still holding from higher levels might be tempted to capitulate on any bounce.
Final Insight
BOME is sitting at a critical juncture right now. With support barely beneath current levels and resistance not too far overhead, the next significant move really comes down to which side gets more volume behind it. If sellers take control, we could easily see $0.000600 or lower. But if accumulation continues and the broader crypto market cooperates, a run back toward $0.000800-$0.001000 is definitely on the table. Anyone trading this should use tight stop losses, wait for clear confirmation signals, and remember you’re playing in high-risk, high-reward territory here.