Recent Developments & Market Context
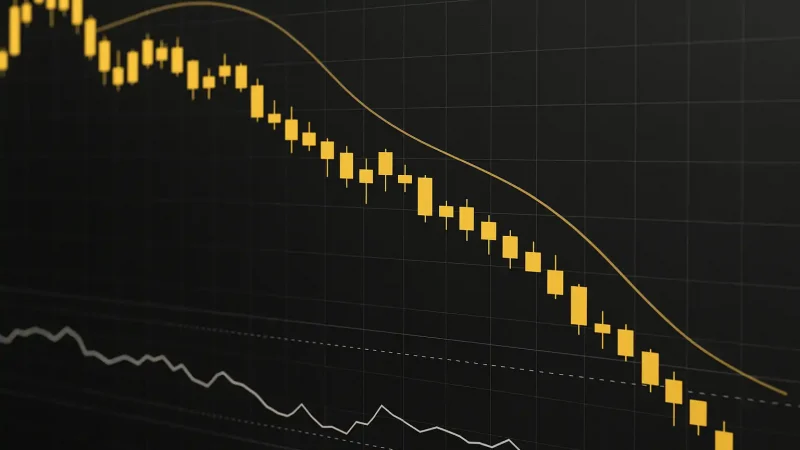
Dogecoin (DOGE) is currently sitting at around 0.13746 USDT, showing a modest drop of about 2.07% in the last 24 hours. While that doesn’t sound too dramatic, the technical picture suggests there’s still a pretty strong bearish undertone that needs addressing before we can get excited about any recovery.
On the regulatory front, we’ve seen some interesting movement with several DOGE-related exchange-traded funds getting approved and launching recently. This definitely adds some legitimacy to the meme coin, though trading volumes haven’t exactly been setting the world on fire. Most traders see this as a positive sign for the long haul, but it’s not really moving the needle right now. The bigger picture isn’t helping much either—rising interest rates, inflation worries, and general nervousness in the markets are putting pressure on riskier assets like DOGE. Sentiment is all over the place: some whale wallets are quietly accumulating, while others have been dumping their bags, making it tough to get a clear read on where things are headed.
Technical Indicators & Key Levels
When you dig into the charts, DOGE is clearly dealing with some headwinds right now.
4-Hour Chart Perspective
– The RSI is hovering around 42.17, which tells us momentum is pretty weak. We’re not in oversold territory yet, so there’s no immediate bounce signal, but we’re also not seeing any real bullish strength either.
– The MACD isn’t looking great—it’s sitting below the signal line with a negative histogram that keeps hanging around. This basically confirms the short-term downward pressure is still intact.
– Price is trading under both the 4-hour Simple Moving Average (sitting at roughly 0.14187 USDT) and the Exponential Moving Average (around 0.14073 USDT), which means the bears are in control of the shorter timeframe action.
Daily Pivot Points & Support Zones
– Looking at daily pivots, the first real resistance is stacking up between 0.13780 and 0.13850 USDT— that’s where any bounce attempt will face its first test. On the downside, immediate support is hanging around 0.13645 to 0.13668 USDT, and these levels are pretty critical for keeping things from falling apart.
– The Rate of Change Percentage (ROCP) on the daily chart shows roughly -9.29%, which indicates there’s been some pretty sharp selling pressure recently. If those support zones don’t hold, we could be looking at a more serious breakdown.
Price Scenarios: What to Expect Next
Based on what the charts are telling us and the current market vibe, here’s how things could play out for DOGE in the coming weeks and months:
Bullish Reversal Case (~1 to 4 Weeks)
If DOGE manages to stay above that 0.1365 USDT support level and buyers actually show up, we could see price climb back above the moving average cluster on the 4-hour chart (around 0.1407–0.1419 USDT). Getting above that zone and staying there could spark a move toward 0.1500 USDT. For this to happen, we’d probably need to see some real buying interest from institutions, better news on the macro front (like central banks easing up on rate hikes), or some positive regulatory developments that get people excited again.
Bearish Continuation Case
If that support zone between 0.1364 and 0.1367 USDT gives way, things could get uncomfortable pretty quickly. The next meaningful support level sits at around 0.1300 USDT, and if that doesn’t hold, we’re looking at 0.1200 USDT after that. With momentum indicators already looking weak and whales seemingly split on what to do, a breakdown could snowball faster than people expect.
Long-Term Potential & Risk Factors
Taking a step back and looking at the bigger picture (think 3-6 months out), there’s potential for DOGE to form what traders call a rounded bottom—basically a gradual U-shaped recovery pattern. If that happens, we could eventually see targets in the 0.20-0.25 USDT range, maybe even higher if the stars align and we get some favorable macro conditions. That said, there are real risks here. Persistent inflation, regulatory crackdowns, or just continued risk-off sentiment across markets could keep DOGE under pressure or even push it down toward 0.10 USDT or lower.
Technical Price Prediction Summary
Given where momentum sits and what the charts are showing, DOGE will most likely bounce around between 0.1300 and 0.1500 USDT over the next couple of weeks to a month. If we see a clean break above around 0.1420 USDT, that would flip the bias more bullish with potential runs toward 0.1500–0.1600 USDT. On the flip side, losing that 0.1365 USDT support would open the door to downside toward 0.1200–0.1300 USDT. Long-term, getting back above 0.20 USDT is definitely on the table, but it’s going to take some major catalysts and a lot more certainty in the broader market before that becomes realistic.