Recent Developments & Fundamental Backdrop
The FLOKI ecosystem has been making some interesting moves recently. The team is heading back to the NYSE trading floor on December 13 for another appearance on Bloomberg TV’s “New to The Street,” which could bring some fresh attention from both institutional players and retail traders. They also showed up as a Bronze Sponsor at Binance Blockchain Week 2025, where they put their gaming platform Valhalla on display through a dedicated booth and livestreams. These efforts are helping push the narrative that FLOKI is more than just another meme coin.
From a technical standpoint, quite a few analysts have been pointing out that FLOKI looks pretty oversold right now, with RSI readings sitting in the high-20s to low-30s. The forecasts are all over the place, but a lot of folks seem to agree on short-term recovery targets around $0.000055, while the more optimistic medium-term projections are eyeing something closer to $0.000185.
Technical Indicator Readings & Price Action Context
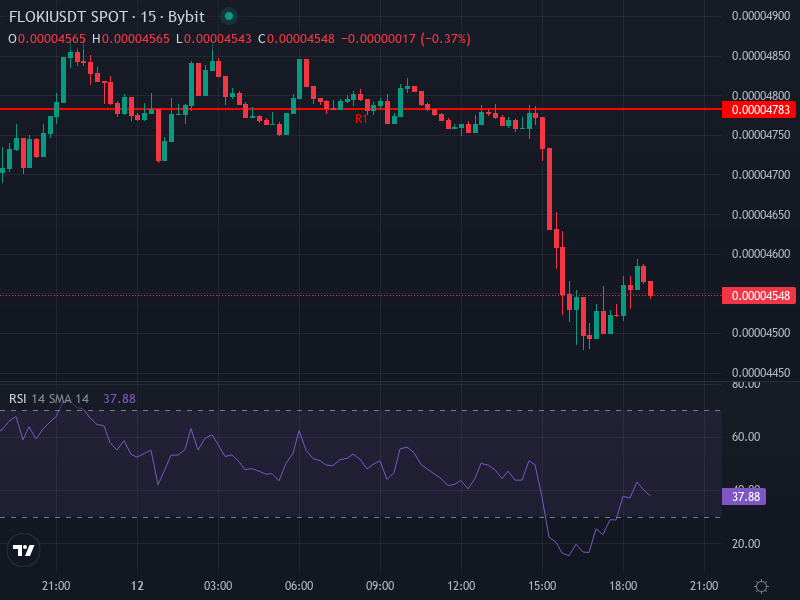
Right now, FLOKI/USDT is trading at about $0.00004558, down roughly 3.14% over the past 24 hours. Looking at the 4-hour momentum indicators, we’re seeing a bit of a mixed bag: the Relative Strength Index is hovering around 38.76—not quite neutral but not screaming oversold either. The MACD is in negative territory, with both the MACD line and signal line below zero and a slightly negative histogram.
The moving averages are telling us where the resistance might be. The 4-hour Simple Moving Average is sitting at about $0.00004833, while the 4-hour Exponential Moving Average is a touch lower at around $0.00004776. Since the price is trading below both of these, we’re looking at some short-term downward pressure.
Daily pivot points show strong resistance in the $0.00005016 to $0.00005168 range (R2 to R3), with support levels starting around $0.00004398 and potentially dropping to $0.00004013 at the lower end. The daily pivot sits right around $0.00004631. These levels are worth keeping an eye on—they’ll likely act as battlegrounds for either a recovery or further breakdown.
Price-Forecast Scenarios Based on Key Levels and Signals
Bullish Reversal Scenario
If the buyers decide to show up, we’ll need to see a daily close above the immediate resistance around $0.000048. That would clear the way toward the $0.000051–$0.000055 zone, with a longer-term target around $0.000070 if the momentum continues. For this scenario to really play out, the RSI needs to climb into the mid-40s, the MACD histogram should flip positive, and we’d need to see daily volume pick up noticeably. A lot of analysts think a bounce to the $0.000055 level is the most realistic near-term target for FLOKI.
Bearish/Deterioration Scenario
If support around the $0.00004507 level doesn’t hold, things could get ugly pretty quickly. We’d be looking at a slide toward $0.00004398, with the potential to test $0.00004013 or even lower. Continued weakness—RSI dropping below 30, persistent MACD negativity, and thinning trading volume—would all point toward this downside scenario becoming reality.
Strategic Insights & Risk Considerations for Traders
Given how oversold FLOKI looks on the technicals, there might be a decent opportunity here, especially if you’re trading on shorter timeframes or don’t mind some volatility. Entry points in the $0.000045–$0.000047 range offer pretty favorable risk/reward, as long as you respect your stop-losses—maybe something below $0.000043 to keep losses contained. For those thinking longer-term, the key thing to watch is whether FLOKI can push through that short-term resistance around $0.0000510. A clean breakout there could open the door to more ambitious targets in the $0.000085–$0.000185 range, assuming the broader market cooperates.
That said, the risks here are real. Meme coins are incredibly sensitive to sentiment shifts and macro factors. Any negative regulatory news, a broader crypto market pullback, or a drying up of speculative capital can wipe out gains in a hurry. Don’t just rely on momentum indicators—they can be misleading in highly volatile assets. Keep a close eye on volume trends for confirmation before making any moves.