Context & Recent Developments
Dogwifhat (WIF) has been making waves in the memecoin community lately, thanks to its dedicated following and some interesting experiments with actual utility. Looking at on-chain data from late November 2025, we’re seeing something pretty interesting—big holders (the “whales”) have been steadily accumulating tokens, while the amount sitting on exchanges keeps dropping. This usually means people are less likely to sell in the short term and are thinking more long-term. Plus, there are some new validator node partnerships on Solana that give WIF a bit more purpose beyond just being another meme token. That said, the price still moves mostly based on technical patterns and how people are feeling about memecoins in general.
Price-wise, we’ve been hanging around $0.40 to $0.50 lately, with plenty of ups and downs depending on what’s happening with other meme coins and the crypto market overall. Some folks are watching the $0.52 to $0.61 range as potential breakout territory, but getting through those levels needs some serious volume and momentum behind it.
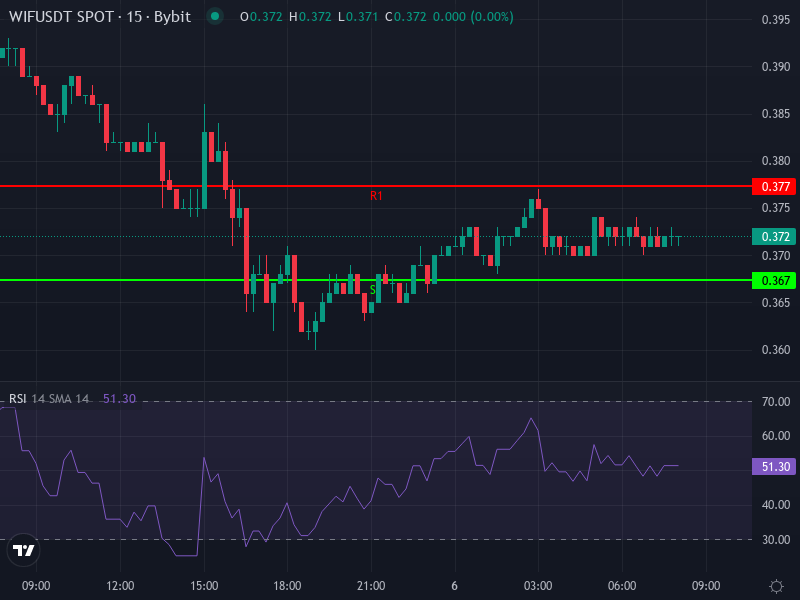
Right now, we’re looking at a price around $0.3725 USDT, which shows a pretty notable drop recently and suggests momentum is fading on the shorter timeframes.
Technical Indicators & Key Levels
Looking at the latest 4-hour and daily charts, here’s what the numbers are telling us:
- RSI (4-hour): Sitting at about 44.34—pretty much neutral territory but leaning slightly bearish. This means there’s still room for the price to drop more, but also room for a bounce back before things get oversold.
MACD (4-hour): Looking bearish right now. The MACD line is sitting below its signal line with a negative histogram around -0.0034, which tells us the short-term upward momentum is weakening.
SMA / EMA (4-hour): The current price of $0.3725 is below both the simple moving average at $0.3806 and the exponential moving average at $0.38016. These are both acting as resistance now, basically ceilings the price needs to break through.
- Daily Pivot Points: The main pivot is around $0.3727. On the upside, we’ve got resistance at R1 around $0.3773, R2 at $0.3827, and R3 at $0.3873. For support, we’re looking at S1 near $0.3673, S2 at $0.3627, and S3 down at $0.3573. These are the levels where we’d expect the price to react.
ROC (1-day): Down about 3.88%—confirming we’re seeing downward pressure lately, with lower highs forming.
Predicted Scenarios Based on Price Action
Bearish Case: Weak Momentum and Further Pullback
If WIF can’t break through that resistance zone around $0.380 to $0.381 (those 4-hour moving averages), we might not see any real strength coming back soon. In that situation, we’d probably see the price drift down toward those daily support levels around $0.3627, or possibly even down to $0.3573 if things get worse. The MACD divergence and RSI staying below neutral back this up. If we see a bearish crossover on the higher timeframes or trading volume starts dropping off, that would make this scenario even more likely.
Bullish Case: Breakout of Resistance with Volume Confirmation
For the bulls to take control, WIF needs to close above that resistance cluster around $0.3806 to $0.381, and ideally we’d want to see trading volume picking up to confirm that it’s a real move and not just a fake-out. If that happens, the first target would be R1 at $0.3773, then R2 at $0.3827, and after that R3 around $0.3873. We’d want to see the RSI climb back above 50, the MACD histogram flip positive, and those moving averages cross over. Any positive news or renewed excitement from the community could definitely help push things toward these resistance levels.
Outlook & Risk Management
Given where the technicals are right now and that pretty significant drop we’ve seen recently (down about 4.93% in the last day), it looks like we’re probably stuck in a range between roughly $0.357 and $0.387 unless something changes the game. The big risk to watch is if we can’t hold that support around $0.3627 to $0.3673—that could trigger more selling down to $0.350 or lower. On the flip side, if we can push above $0.380 to $0.381 with some real conviction, we might see a move toward $0.40, which is a pretty important psychological level.
If you’re looking to go long, it makes sense to set stops just below that critical support around $0.362, with targets inside those resistance zones. That gives you roughly a 1:2 risk-reward ratio if you’re entering near current prices. You could try more aggressive entries below support if the overall market sentiment improves, but that obviously carries more risk. Bottom line—until we see the MACD and RSI shift decisively in one direction or the other, it’s probably smart to be careful with your position sizes and focus on entries that make sense from a risk perspective.