In a paradox that continues to puzzle observers, Pi Network’s user adoption and on-chain metrics are
soaring, while the token’s market performance shows increasing fragility. As Q4 2025 unfolds, data
reveals that network growth within Pi has outpaced traditional metrics of market strength—a divergence
that now places Pi’s price at a precarious fork. Can on-chain enthusiasm rescue a struggling chart?
Price Deterioration Meets Surging Ecosystem Adoption
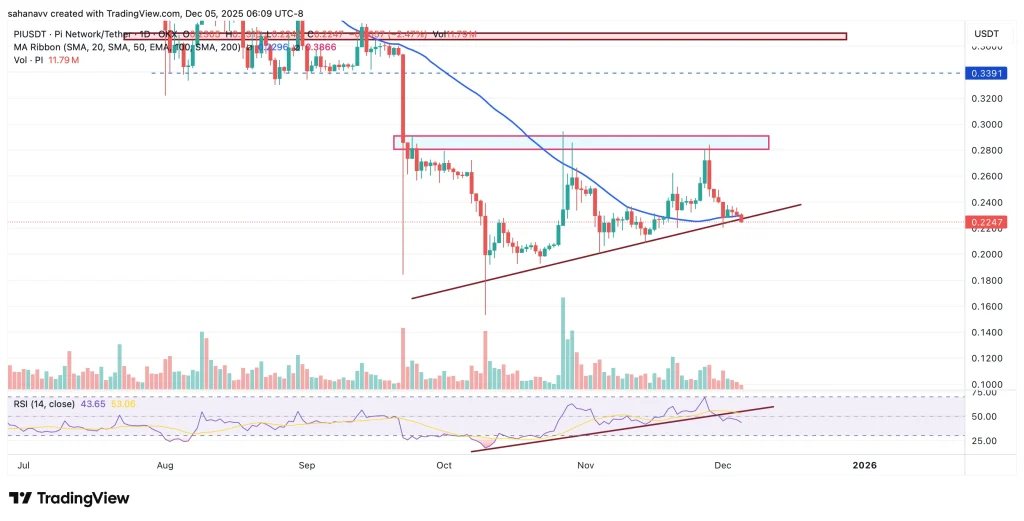
Despite strong signs of increasing daily active users and developer interest, Pi’s token price is flirting with a
breakdown below $0.22—well below recent highs near $0.29. This decoupling reveals something deeper at play:
while user engagement has carried the project’s foundation forward, market participants are losing short-term
confidence in price action. The failure to maintain price gains despite favorable fundamentals now defines Pi’s
December outlook.
Technical analysts point out that the $0.223–$0.225 range, which had supported Pi since early October, is
eroding. The 50-day moving average has flipped from support to resistance, and the RSI trendline—formerly a
bullish anchor—has quietly snapped. Volume, once a secondary concern, is speaking louder than fundamentals:
liquidity has thinned, making sharp price moves more probable on minimal trades.
Compression Builds—And a Break Feels Imminent
The technical structure now resembles a coiled spring. The price sits in a tightening wedge pattern atop a
formerly robust uptrend. A break below $0.22 could prompt a swift move to test the crucial $0.20 support,
where order book data suggests limited bids. If this zone fails, the next major buyer interest rests near $0.18,
a 38% drawdown from late-November highs.
Moreover, the breakdown in momentum indicators precedes price action—a classic setup for trend reversals.
Traders are now watching Pi’s mid-range barrier between $0.25 and $0.27, which has served as resistance
during three separate rallies. These repeated failures to reclaim bullish structure reduce probability for a
bullish continuation and hint that the bears are gaining control from above.
Mid-Range Rejections Signal a Shift Toward Distribution
When markets repeatedly reject a price area without higher highs, they often enter a distribution phase—a
period where smart money exits before broader declines. Pi’s pattern fits the mold: Three failed attempts to
breach $0.27 since October have resulted in increasingly shallow rallies. In this light, the current structure
no longer represents consolidation—it’s leaning toward topping.
Still, hope lingers in the form of long-term trendlines. The October uptrend will technically remain intact until
$0.20 breaks with confirmation. Some traders suggest a bounce at support, paired with rising volume, could
signal one last attempt by bulls to drive a retest of the $0.27 upper limit. But without news catalysts or a surge
in fiat inflows, this scenario appears increasingly unlikely.
Community Eyes Support With Cautious Optimism
Across online forums and trading groups, Pi’s community is grappling with a familiar dilemma: do network
fundamentals eventually lift price, or is speculative pressure simply too dominant in the short term? Many
Pi advocates point to the project’s off-exchange development model as the reason for price lag, noting
that internal economic activity remains strong. Pi’s developers have also teased future integrations and real-world
utility partnerships—factors that may support bullish narratives moving into 2026.
However, market technicians remain focused on what’s on the screen. As one analyst put it: “Until this trades
above $0.25 on volume, the chart cares little for how many wallets have downloaded the app.” Such is the
tension between network value and market price—a familiar battle in the crypto space, but one that Pi is
presently losing.
December Will Be Defined by This Line: $0.22
Whether Pi price stabilizes or breaks decisively lower hinges almost entirely on the ability to defend the
$0.22 trendline. Current price compression is rare without resolution. Bullish continuation requires not only
preservation of this level, but regain of the 50-day moving average and a daily closing above $0.25. Anything
less risks a drift into lower lows.
Short-term outlook by scenario:
- Bullish: Bounce from $0.22 → reclaim $0.25 → test $0.27
- Bearish: Break below $0.22 → $0.20 test → $0.18 extension
With liquidity thinning and macro sentiment sideways, Pi’s price is threading a needle through uncertainty.
Watch volume and daily closes—because over the next few sessions, the chart won’t wait.