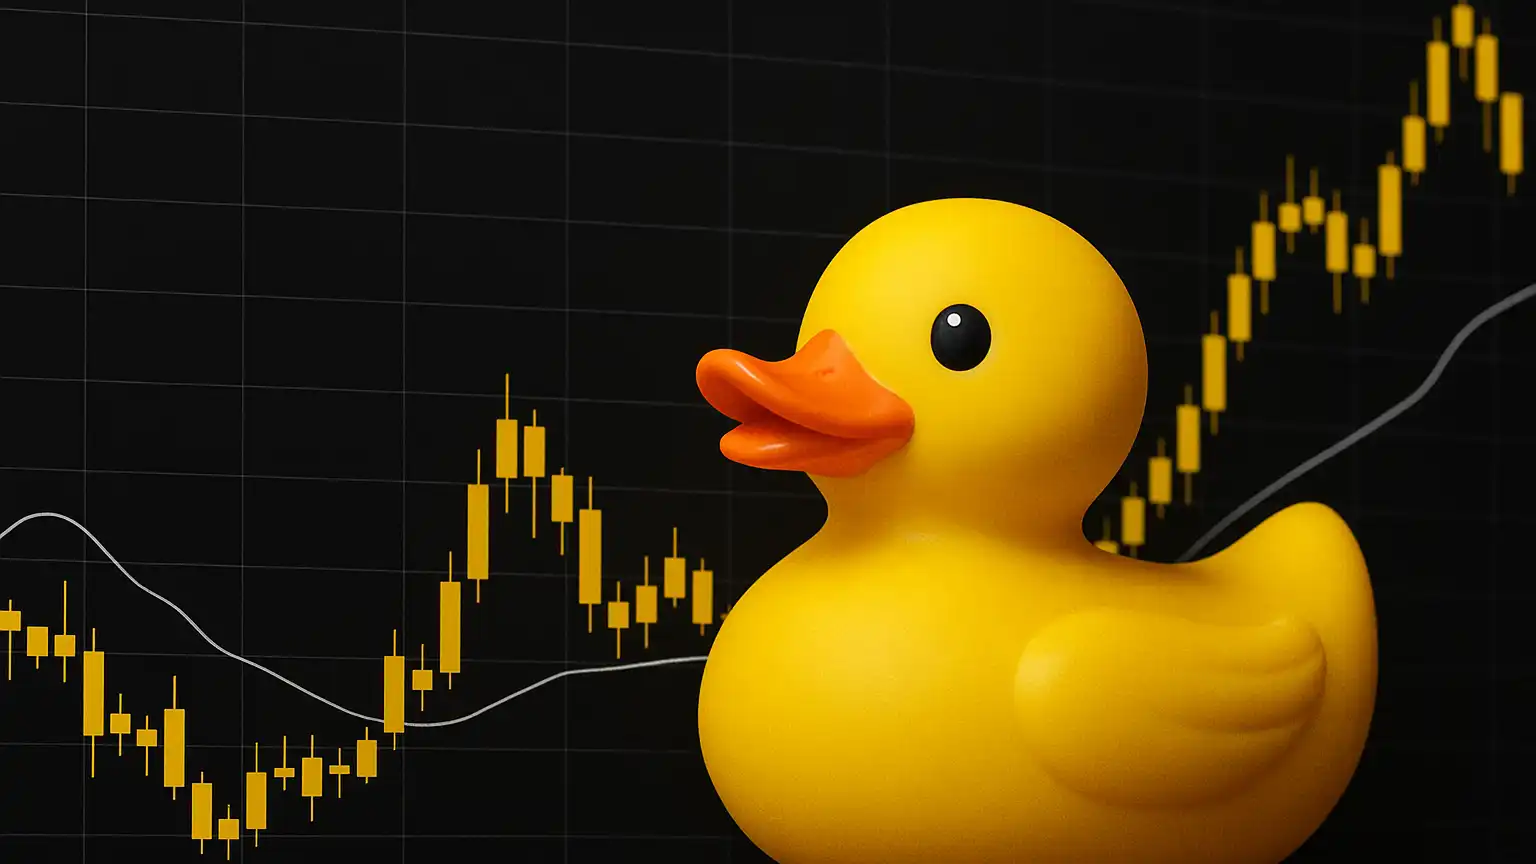
Current Market Snapshot & Fundamental Signals
Right now, DUCKY is hovering around $0.00070–$0.00071. Daily trading volume sits near $650,000–$660,000, and the market cap is somewhere around $290-300 million. There are roughly 414.4 billion DUCKY tokens in circulation out of a max supply of 420.69 billion. In the grand scheme of things, this puts DUCKY squarely in the smaller-cap meme-coin territory.
What’s driving the price? Honestly, not much that’s DUCKY-specific. Most of the recent gains seem to ride Bitcoin’s coattails—when BTC pumps, DUCKY gets a lift. Volume does spike during these moves, showing there’s interest from traders, but real catalysts like partnerships or product updates? Pretty much absent.
Technical Indicators & Key Levels
Let’s break down what the charts are telling us:
- Relative Strength Index (RSI): Currently hanging out in neutral territory, around 45-55. This means DUCKY isn’t overbought or oversold—basically, it could go either way from here.
- Moving Averages: The 50-day average is sitting above the current price, acting as a ceiling. The 200-day is also trending down, which reinforces a longer-term bearish vibe.
- Oscillators & Sentiment Metrics: Moving averages are flashing mostly “sell” signals. Oscillators are all over the place—some show a bit of strength, but most lean neutral to slightly bearish.
Support is sitting around $0.00065–$0.00070. If the price falls, that’s where it might find a floor. On the flip side, resistance is clustered near $0.00078–$0.00080, with some intermediate barriers around $0.00075. Breaking above $0.00080 would take serious volume and a favorable market backdrop.
Price Projections: Short to Medium Term Outlook
Here’s how things could play out over the next few weeks:
Scenario A: Moderate Bullish Breakout
If Bitcoin holds strong—say, above $70,000—and meme-coin mania stays hot, DUCKY could punch through that $0.00078 resistance and climb toward $0.00080–$0.00082 within the next 2-4 weeks. This would need both a supportive broader market and maybe some community hype or social media buzz to get things moving. Beyond that level, we’d start testing those descending moving averages.
Scenario B: Bearish Rejection & Pullback
But if crypto sentiment cools off or DUCKY gets rejected at resistance, we could see a drop back to support. The $0.00070 level would be the first line of defense. If that breaks, we’re looking at $0.00065–$0.00060. In this scenario, those bearish moving averages would keep applying pressure, and low volume could make things slide faster. We might see oversold readings, but without a catalyst, any bounce would probably be weak.
Where Risk Meets Opportunity & Trader’s Notes
• DUCKY swings hard and fast. Don’t be surprised by sudden moves in either direction.
• Keep leverage in check and use stop losses—ideally near those key support levels we talked about.
• Watch Bitcoin like a hawk. DUCKY’s movements are heavily tied to BTC’s daily performance.
• Volume is your friend. If daily volume pushes above $1 million around resistance zones, that could signal a real breakout.
• Remember the supply situation: with billions of tokens floating around and limited real-world use, this is speculative territory.
Probable Price Ranges Over Next 30-60 Days
Here’s what seems realistic based on current conditions:
- Bullish case: $0.00080–$0.00085 (if we break through $0.00078 resistance)
- Neutral case: $0.00070–$0.00075 (sideways choppy action)
- Bearish case: drop to $0.00060–$0.00065
Wrapping Thoughts
DUCKY is basically sitting at a crossroads. Without any real project developments or organic growth, it’s going to follow whatever the broader altcoin market does. The technicals hint at some upside potential if resistance breaks, but there’s plenty of downside risk if momentum fades. If you’re trading this, keep your risk tight, watch the volume closely, and pay attention to what Bitcoin’s doing. The difference between catching a breakout and getting dumped on comes down to timing and discipline.