Recent Market Context and Price Action
Right now, WOULD is sitting around $0.04314 USDT, having dropped about 1.07% in the last 24 hours. Sure, that doesn’t sound like much, but when you look at the technical signals and how supply is structured, this small dip could mean more than it seems at first glance.
The market cap is still pretty small, with roughly 999 million tokens in circulation out of a billion total—so basically, almost everything’s already out there. The problem is trading volume is pretty thin, which means even small amounts of buying or selling can swing the price around quite a bit. Event data shows the token has come a long way from its lowest point ever, but it’s still got a fair distance to go before hitting those all-time highs again. That gap suggests there’s both risk and opportunity here. Overall sentiment feels neutral or maybe slightly bearish right now, with that recent 24-hour dip making short-term holders a bit more cautious.
Technical Indicators and Key Levels
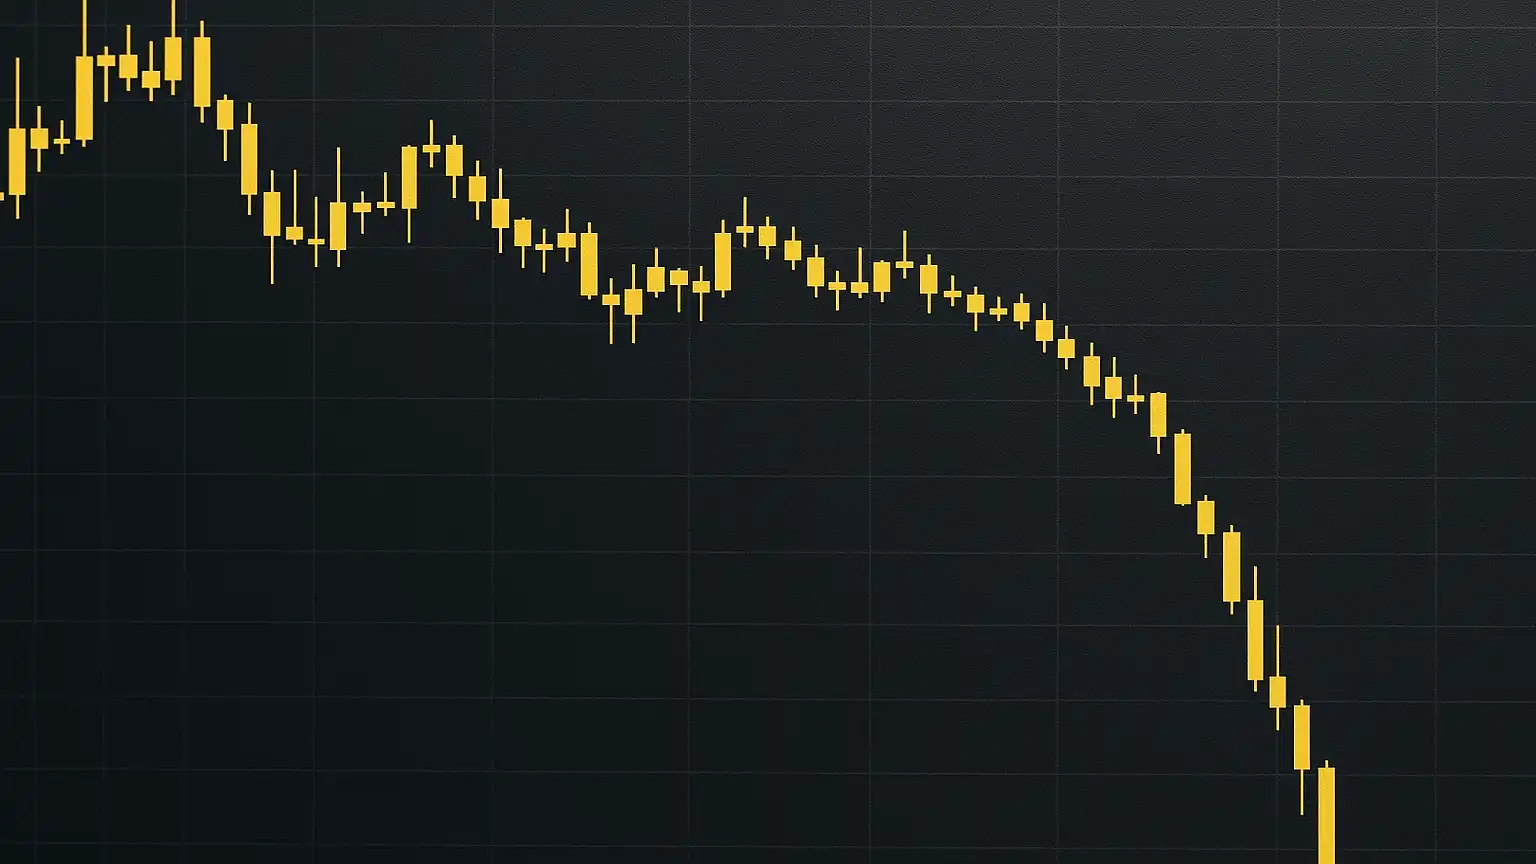
We don’t have the most recent 4-hour or daily chart data for WOULD/USDT handy, but we can still work with some foundational technical analysis to get a decent picture:
Earlier analysis pointed to resistance somewhere around $0.026–0.028, with support down near $0.022–$0.024. Since WOULD is trading well above those levels now, those zones are more like historical markers than current battlegrounds. Still, they’re useful for understanding where things might land if we see a bigger pullback.
Looking at indicator readings from before (adjusted for the current price range), we’re seeing strength in trend metrics but some warning signs in momentum indicators. The RSI and Stochastic RSI were flashing overbought signals earlier. Meanwhile, the ADX was showing a positive trend direction, and the MACD was sitting neutral. This mixed bag suggests momentum might be slowing down, and we could see bearish divergences pop up unless buyers step back in.
Volume is really the missing piece here. With such light trading activity, any breakouts or breakdowns won’t be reliable until we see volume backing them up. The levels worth watching are $0.040–$0.045 for near-term resistance, and if things turn south, support should kick in around $0.030–$0.035.
Scenarios & Price Predictions
Bullish Scenario
If WOULD manages to break above $0.045 and actually stay there with decent volume behind it, we could see a push toward $0.055–$0.060. In that case, trend indicators would likely flip bullish, and momentum oscillators like the RSI would move back into a healthier mid-range. The big requirement for bulls here is genuine buying demand from new investors, plus some positive news—maybe a new exchange listing or some kind of protocol upgrade.
Bearish Scenario
On the flip side, if the price can’t punch through $0.045 and momentum keeps fading, we’re probably looking at a slide down to the $0.030–$0.035 area over the next few weeks. If it drops below $0.030 on volume, things could get uglier fast, potentially heading toward that $0.020–$0.022 historical support zone. In this scenario, the MACD would probably show bearish crossovers and the RSI would drift down toward oversold territory.
Risks, Catalysts, and Final Insights
The main risks here include thin liquidity, which makes those support and resistance zones less reliable than they’d be in a more active market. There’s also the broader crypto environment to consider—regulatory pressures, exchange policy changes, or general market fear could all weigh on price. And let’s not forget that technically, things might be stretched without a proper correction. On the positive side, good news like a new exchange listing, improved token utility, or protocol partnerships could spark a quick rally and push those resistance levels higher.
Bottom line: WOULD is in a tricky spot where price could swing meaningfully either way based on what happens with volume and trading activity in the near term. There’s definitely upside potential into the mid-five-cent range, but there’s also real risk of dropping back toward those historical support levels if buyers don’t show up. If you’re more conservative, it probably makes sense to wait for confirmation—higher volume and a clear break above $0.045—before jumping into long positions. If you’re more aggressive, you might consider adding near those smaller support zones, but keep your stop-losses tight.