Recent Developments & Market Positioning
GOHOME has carved out an interesting niche in the meme-coin space by blending political satire with genuine community engagement and some pretty clever scarcity mechanics. What really sets it apart is its origin story—born from a viral glitch event—and its unusual tokenomics. We’re talking about a fixed supply of roughly 10 million tokens, with 9 million locked away until 2029. That leaves less than 500,000 tokens actually circulating right now, creating a level of scarcity that most meme coins can only dream about. The team hasn’t just been sitting on their hands either. They’ve been building out real utility through partnerships in gaming (like their work with GAUtoken), real estate lending via TRL.co, and CeDeFi platforms like All InX. These moves help GOHOME stand out from your typical pump-and-dump meme coin, though we’d be lying if we said execution risk wasn’t still a major factor here.
Technical Landscape: Indicators, Trends, and Current Status
Right now, GOHOME/USDT is trading somewhere in the $90–$95 neighborhood, hovering just above that $91 mark. To put things in perspective, this token hit an all-time high near $368 back in March 2025, which means we’re looking at about a 75% drawdown from peak levels. Ouch. That’s partly narrative correction, partly the broader meme-coin bloodbath we’ve been seeing. The market cap sits around $44.7 million with daily trading volume of roughly $1.1 million—not huge, but enough to show there’s still life in this thing. That relatively thin liquidity does mean you’ll see some wild price swings though.
Key Indicator Signals
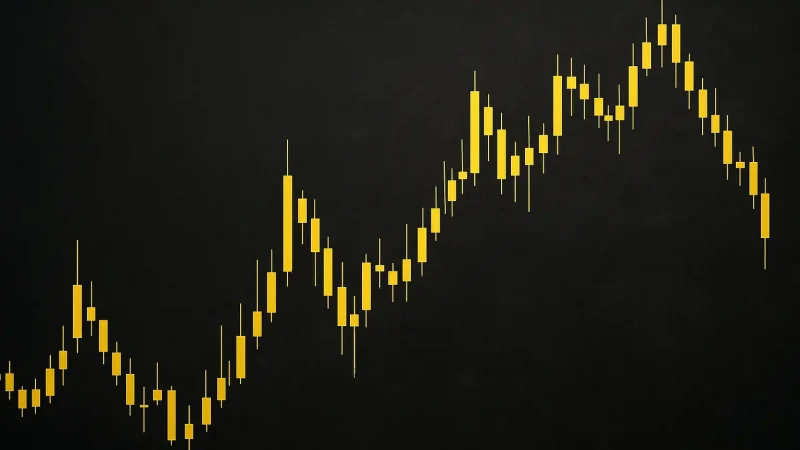
The charts aren’t painting a pretty picture at the moment. Nearly all the major moving averages—your MA5, MA10, MA20, MA50, the whole gang—are pointing downward, and price is sitting below all the key exponential moving averages. That’s textbook bearish structure. The 14-day RSI is hanging out in oversold territory around 25–30, which could mean we’re due for a short-term bounce, but don’t mistake that for a trend reversal. Momentum indicators and MACD are both looking weak. When you tally up the technical indicators, you get something like 2 bullish signals versus 12 bearish ones—not exactly a vote of confidence. There’s a resistance zone that’s built up between $110–$125 that GOHOME just can’t seem to crack convincingly.
Short- & Medium-Term Price Projections
Based on where things stand now, that $110–$125 resistance zone is the next major hurdle. If GOHOME can push through $120 with some decent volume behind it, we could see sentiment flip and maybe test the $150 area in a bullish scenario. But if it fails to reclaim that $110 level, the bears stay in control and we’re looking at support around $80–$90 as the next line of defense. Break below that and things could get ugly fast—we might see a drop toward $40–$60 if risk appetite really dries up. Short-term forecasts are calling for prices around $94 or so, with some one-month outlooks even more bearish at around $89.
Looking further out, the fundamentals—that crazy token scarcity, the locked supply, and the expanding utility partnerships—do suggest some real upside potential if things go right. We could theoretically see prices climb back into the hundreds of dollars if the partnerships deliver and the hype train keeps rolling. But let’s be real: there’s also a very real possibility that GOHOME just chops around in this current range for a while, with occasional spikes tied to news announcements rather than any sustained upward momentum. This one’s definitely high risk, high reward.