Market Introduction: Sentiment, Fundamentals, and Recent Moves
WOULD sits in the meme-coin category, but it’s got a few things going for it that set it apart from the typical pump-and-dump tokens. Built on Solana, it’s non-inflationary, the contract ownership has been renounced, and the LP tokens are burned—all of which basically means there’s less centralized control and more alignment with what long-term holders actually want. The team has emphasized transparency and scarcity from day one, and the community still believes WOULD has what it takes to outlast the usual meme coin chaos.
Right now, WOULD is trading around 0.04661313 USDT, down about 2.08% over the last day. The broader market’s been pretty risk-off lately, and WOULD’s technical signals aren’t exactly screaming bullish. The RSI has dropped to around 39.8—not oversold yet, but definitely losing steam. The 50-day moving average is sitting above the current price, and the 200-day is expected to trend down toward roughly $0.1424 by early March. In plain English: there’s still heavy resistance overhead for the longer term.
Technical Indicators and Key Levels for WOULD
Support Zones: The nearest support is just below where we are now, around $0.04678. If that breaks, the next stronger level to watch is near $0.04553, with a critical zone around $0.04428 that could act as a last line of defense before things get uglier.
Resistance Levels: On the flip side, WOULD needs to push past about $0.04804 (today’s pivot) to have any shot at challenging the first real resistance at $0.04928. If bulls can actually get some momentum going, there are more hurdles around $0.05054 and $0.05179. Without solid volume and confirmation, any upward moves will probably fizzle out pretty quick.
Indicator Conditions:
• The 14-day RSI at roughly 39.8 shows a neutral-to-weak vibe—still above oversold, but sliding.
• Most moving averages are currently above price, which means resistance is real and we’d need bullish crossovers to change the trend direction.
• Sentiment is mixed—about 55% bullish in recent readings—so traders aren’t exactly convinced one way or the other.
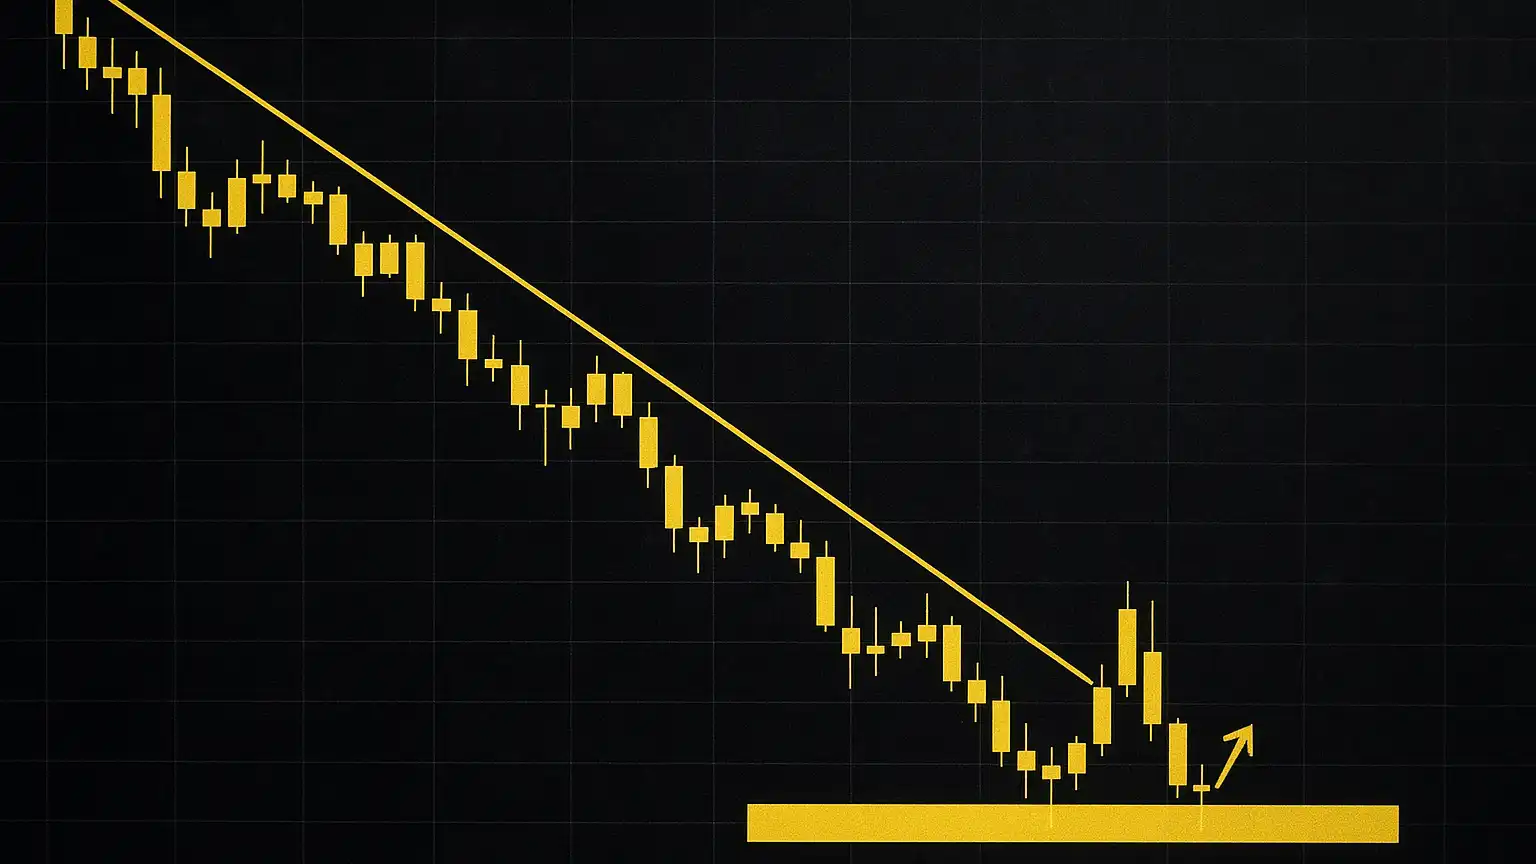
Chart Patterns and Reversal Scenarios
WOULD looks like it’s been making lower highs and lower lows since its recent peak. If the price can put in a higher low above that $0.04428 mark, we might see some consolidation between roughly $0.046 and $0.050, which could set up a base for a reversal. But if that critical support gives way, expect things to accelerate downward—probably toward the $0.040–$0.042 range.
Forecast and Trading Scenarios
Looking at the data we have, the short-term outlook suggests WOULD might try to retest resistance near $0.050 if one of two things happens: either a clean break above that $0.04804 pivot with real volume behind it, or the broader market gets a mood boost—think stronger altcoins and better risk appetite across the board.
In a bearish case, if that $0.04678 support level doesn’t hold, watch for a drop toward $0.0455, with the stronger support around $0.04428 being a potential bounce zone. If that breaks too, things get dicey fast—we could be looking at a slide toward $0.040 or lower, depending on how aggressive the sellers get.
Recent News & Broader Implications
There hasn’t been any major news or announcements specific to WOULD in recent months. No roadmap updates, no big events on the calendar. Community engagement is really the main thing keeping it alive right now. On the macro side, there’s been increasing global chatter around crypto regulation—stablecoin reserve disclosures, market oversight, the usual stuff—and that’s adding a layer of risk to speculative plays. WOULD, being a meme coin at heart, is especially vulnerable to shifts in broader sentiment driven by regulatory headlines and economic uncertainty.
Final Insight: Managing Risk & Opportunity
WOULD is at a crossroads right now. The decline has been steady but not catastrophic, yet the technical resistance is stiff. For traders looking at short-term plays, keep an eye on those key resistance zones for any breakout signals. If you’re holding long-term, the $0.044 area is critical—it’s basically make-or-break support. With volatility this high, playing it safe with tight stop-losses, scaling positions based on confirmation, and staying aware of the bigger macro picture is going to be key.