Recent News & Context Setting
Mog Coin (ticker: MOG) is one of those high-volatility, community-driven memecoins that just won’t quit making noise. Recently, things got interesting when Canary Capital filed for what could be the first memecoin-focused ETF that tracks MOG. That’s a pretty big deal—it shows this isn’t just another joke coin anymore, though nobody knows if regulators will actually approve it. Analysts who’ve been digging into this throughout February 2026 are painting a mixed picture: yes, there’s potential if adoption picks up and the broader market cooperates, but let’s be honest—the coin doesn’t really do much beyond rallying the community, and that’s a real weakness.
Looking at the numbers, CoinGecko data puts Mog Coin’s market cap somewhere between $70-80 million USD, with daily trading volume bouncing around $5-7 million. That’s decent but nothing jaw-dropping compared to bigger altcoins. There are about 390 trillion MOG tokens already out there circulating, and the fully diluted valuation is pretty close to that—meaning most of the supply is already on the market.
Technical Indicators & Current Signal Landscape
From a technical standpoint, the signals are all over the place right now. Recent analysis shows moving averages leaning bullish—the short and mid-term averages are sitting at or above current price levels. The RSI is hovering around 67.8, which suggests strength without being crazy overbought yet. Stochastic and ROC indicators are pointing upward too, hinting at building momentum. But here’s the catch: the ADX is running high and flashing what some would call a “Sell” signal. That doesn’t necessarily mean dump everything, but it does suggest the trend might not have strong legs or could reverse without warning.
Price-wise, there’s a cluster of resistance around $0.00000019 USD based on both classic and Fibonacci pivot points. That’s the ceiling bulls need to break through. On the downside, support looks established near $0.00000014-$0.00000015 from recent lows. If the price drops below that zone, we could see further weakness. But clear that resistance level, and things might get interesting fast.
Recent Price Action & Structural Patterns
Right now, MOG seems to be consolidating after some recent drops, and volatility is still running hot. There’s been chatter in the community about a “Golden Cross” forming earlier—that’s when the 50-day moving average crosses above the 200-day, which is usually bullish. Some folks are also pointing to symmetrical triangle patterns that could indicate accumulation happening under the surface. But these patterns need confirmation with solid volume and a clean breakout above resistance. The excitement is building, but we haven’t seen those explosive volume surges yet that would really confirm anything.
Price Prediction Scenarios Based on Indicators
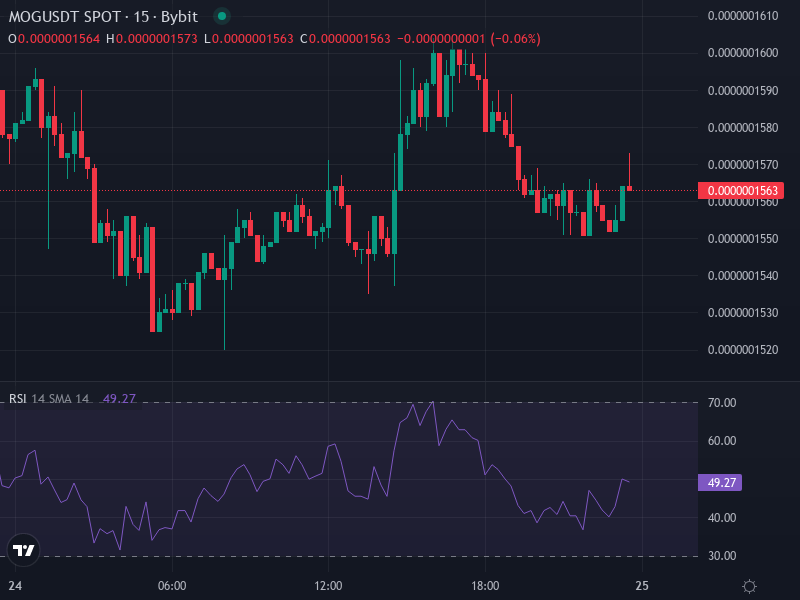
Given where we’re sitting right now—around $1.57e-7 USD with a negative 24-hour change—here’s how things might play out depending on which way the technicals break.
- Base Case (Moderate Bullish Breakout): If MOG manages to punch through that resistance near **$0.00000019**, we could see it test and possibly push toward **$0.00000025-$0.00000030** in the short term. That would line up with the momentum indicators and growing sentiment. Keep in mind though, RSI would likely hit overbought territory above 70, which usually means pullbacks are coming unless volume really supports a sustained rally.
- Bearish or Sideways Case: On the flip side, if MOG fails to break that resistance and instead drops below support around **$0.00000014**, we’re probably looking at consolidation closer to **$0.00000010-$0.00000012**. This becomes more likely if the broader market turns risk-off or if some whales decide to take profits. Weakening ADX or a MACD turning flat or negative would back up this scenario.
- Long-Term Bullish Case: Now, if things really go right—think ETF approval, major exchange listings, or actual utility starting to emerge through NFTs or DeFi integrations—MOG could realistically target **$0.00000150-$0.00000200** over the next 12-24 months. But that’s a big if. It would require breaking through multiple resistance levels, sustained high volume, and the broader crypto market staying friendly.
Implications for Investors & Risk Management
Look, with mixed technicals and the speculative nature of Mog Coin, you really need to be careful here. Don’t go all-in—keep your position sizes conservative, at least until we see a confirmed breakout above that resistance level. Pay attention to divergence too: if the price climbs but volume doesn’t follow, that’s often a red flag for reversals. On the other hand, if whales start buying big or a major exchange listing drops, momentum could shift in a heartbeat—and that’s when you should consider tightening stop losses or taking some profits off the table.
One more thing to remember: MOG is way down from its all-time high back in late 2024. A lot of the upside potential here depends on narrative, social media buzz, and news flow. Keep a close eye on what happens with that proposed MOG ETF, watch for new exchange listings, and look for any signs of actual utility being developed. For a memecoin, those catalysts matter way more than usual—they’ll likely be the make-or-break moments that determine where this thing goes next.