Recent Developments & Market Context
PEPE hasn’t been doing much lately, honestly. The meme coin dipped about 0.78% in the last 24 hours and is now hovering around 0.000004003708678866578 USDT. What’s interesting though is that while PEPE’s been kind of stagnant, investors haven’t completely abandoned meme coins—they’re just looking elsewhere. There’s been some buzz around newer presale projects like Pepeto, which tells us that people are still hunting for those high-risk, high-reward plays.
Anyone who’s followed PEPE knows it’s all about hype and social media momentum rather than any real fundamentals. When the community gets excited and volume picks up, PEPE can really take off. But that hasn’t been happening recently. The vibe right now is pretty neutral, maybe even slightly bearish, and it feels like the token is just waiting for something—anything—to spark some action.
Key Technical Indicators
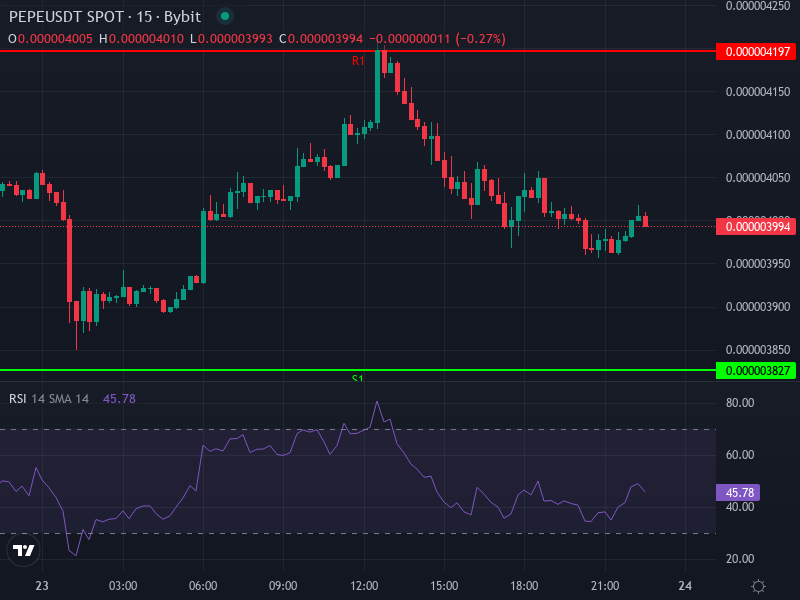
If you look at the 4-hour chart, the RSI is sitting at about 39.65. That’s not screaming oversold, but it’s getting close. We’re not seeing any strong signals that buyers are ready to jump back in yet, though.
The MACD situation isn’t great either—it’s slightly negative with the MACD line sitting below the signal line. The histogram shows some weak negative momentum, which basically means sellers have a bit more control right now. There’s no clear sign of a reversal coming anytime soon.
Now for the moving averages: the 4-hour SMA is around 0.0000041557 USDT, and the EMA is just under that at roughly 0.0000041355 USDT. PEPE’s current price is trading below both of these, which means there’s some resistance overhead that needs to be broken through. The fact that the SMA and EMA are so close together suggests the price is basically stuck in a tight range without much direction.
Support, Resistance & Price Prediction Scenarios
Looking at the daily pivot points, we’ve got some clear levels to watch. On the upside, resistance is stacked around R1 at about 0.0000041967 USDT and R2 at roughly 0.0000043933 USDT. If PEPE drops, there’s solid support at S1 around 0.0000038267 USDT, with even stronger support at S2 near 0.0000036533 USDT. Breaking below S1 could get ugly and send the price tumbling toward S2. On the flip side, getting above R1 would be a good sign that recovery is underway.
Here’s how things could play out:
- Bullish Case
- If PEPE manages to climb back above those moving averages (around 0.0000041355-0.0000041557) and actually holds there, we could see a push toward R1 at 0.0000041967 pretty quickly. With enough buying pressure and volume, breaking R2 at 0.0000043933 isn’t out of the question. That would give us somewhere between 15-20% gains from where we are now.
- Bearish Case
- If support at S1 (around 0.0000038267) doesn’t hold, things could get messy fast. We’d probably see a slide down to S2 at 0.0000036533, and if the selling really picks up, S3 at 0.0000034567 could be in play. We’re talking about an 8-15% drop from current levels if the bears take control.
Mid-Term Outlook & Key Triggers to Monitor
Over the next few weeks to a month, everything really depends on whether trading volume picks up and if the broader meme coin community gets excited again. PEPE needs a catalyst—maybe a major exchange listing or some viral moment on social media. If that happens and volume surges, we could realistically see PEPE targeting somewhere between 0.0000050 and 0.0000065 USDT. But without any new hype or solid volume backing it up, PEPE will probably just keep drifting sideways or slowly bleed toward those lower support levels.