Recent Developments and Market Context
Notcoin (NOT), which runs on the TON ecosystem and gets distributed through Telegram, has been experiencing some pretty mixed reactions from investors lately. It did really well earlier, shooting past $0.02 after going viral through its gaming features and aggressive airdrop campaigns. But things have cooled off quite a bit since then—both market cap and trading volume have taken a hit. The fundamentals don’t look particularly strong right now, and recent analysis suggests NOT has only managed to show a bit of strength when other altcoins rotate, without any real catalysts of its own driving the price.
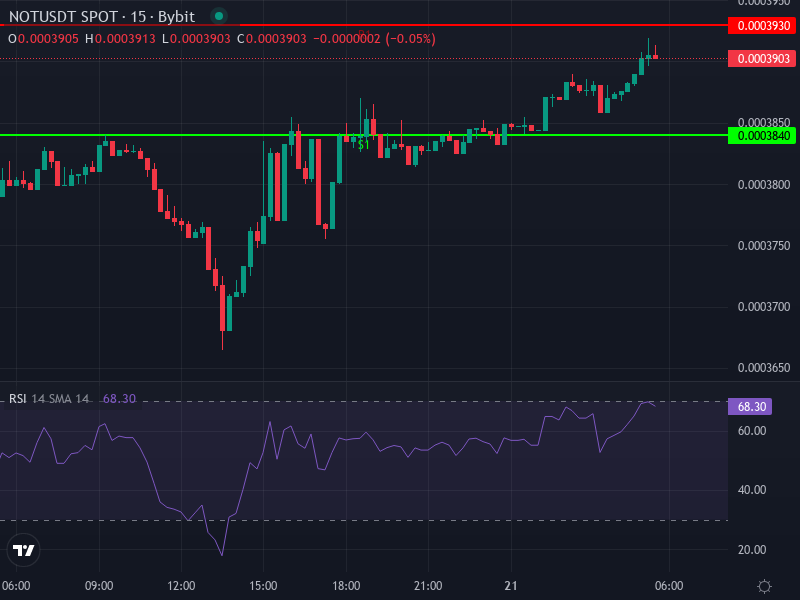
Looking at CoinMarketCap’s AI data, NOT did see a slight uptick in 24-hour volume and performed marginally better against Bitcoin during a relatively quiet market period. Right now, it’s facing resistance around $0.00045 with support holding near $0.00039. Without any major news or developments on the horizon, the token will probably just follow broader market movements—things like inflation reports or Federal Reserve decisions are likely to be the main drivers in the short term.
Technical Indicators: Current Readings and Near-Term Bias
Looking at the 4-hour chart, NOT is trading just under its 4-hour Simple Moving Average (sitting around $0.00039107) while staying pretty close to the 4-hour Exponential Moving Average (about $0.00038941). The Relative Strength Index for this timeframe is hovering near 50.5, which basically means the momentum is neutral—it’s not pushing into overbought or oversold territory.
The 4-hour MACD shows a slight negative reading (the MACD line is below the signal line), but the histogram is getting narrower, which could mean the bearish momentum is starting to lose steam. When you zoom out to the daily timeframe, pivot point analysis shows resistance levels at roughly $0.000393, $0.000397, and $0.000402, with support sitting around $0.000384, $0.000379, and $0.000375.
Support & Resistance (Daily)
The immediate ceiling is in the $0.000393–$0.000402 range (that’s the daily R1 to R3 levels). If the price can push through those levels with conviction, we might see it head toward $0.00045. On the downside, there’s a cluster of support between $0.000375 and $0.000384 where buyers might step in. If it drops below $0.000375, things could get dicey and we might see a steeper decline.
Mid-Term Scenarios: Price Forecasts and Risks
Based on what the charts are telling us and current market conditions, NOT will probably trade sideways in the near term unless we see a significant surge in buying volume. In a neutral or slightly positive scenario, NOT could work its way back up to that resistance around $0.00045 over the next few weeks. If broader market conditions improve or there’s some positive news from the ecosystem, it might test that level and potentially push higher.
But here’s the thing—if macro conditions turn sour (think hawkish Fed comments or general market weakness), NOT could easily retest support in the $0.00039–$0.00038 area, and we might even see it drop to $0.00035. Technical ratings from platforms like Bitget show most moving averages are bearish on both daily and weekly timeframes, which tells us the overall trend is still facing headwinds.
Price Targets Over the Next 3–6 Months
• Bearish scenario: Continued consolidation or slow decline, probably trading between $0.00035–$0.00040.
• Neutral scenario: Gradual climb back toward $0.00045 resistance, assuming BTC and the broader market stay relatively stable.
• Bullish scenario: If it breaks above $0.00045 with strong volume, we could see a move toward $0.00055–$0.00060. On the flip side, losing key support could send it down to the $0.00030–$0.00035 range.
Right now, NOT is trading at about $0.0003899, which is up roughly 2.56% in the last 24 hours. Given all the mixed signals—neutral RSI, price sitting below the SMA, declining moving averages, but a narrowing MACD histogram—the sensible approach is to stay cautious. Keep an eye on volume changes, any developments from the Ton Network or Telegram, and broader economic data. These will be your best indicators of whether NOT can flip the script and head higher or if more downside is in the cards.