Current Market Context and Recent Catalysts
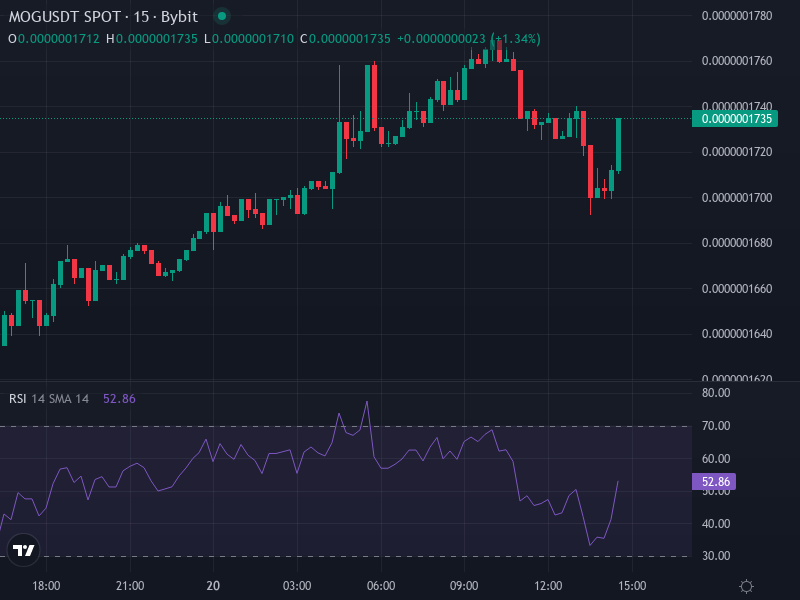
Right now, Mog Coin (MOG/USDT) is trading at around 0.0000001726 USDT after climbing roughly +4.90% in the last 24 hours. This fits pretty well with what we’re seeing across the memecoin space in early 2026—speculative traders are dipping their toes back into these high-risk, high-reward tokens as broader economic concerns start to ease up. One of the bigger news items recently was Canary Capital’s filing with the U.S. SEC to create a spot ETF tracking MOG. That filing briefly pushed the market cap above $169 million and gave the daily price a nice 5%+ bump before things cooled down a bit. Sure, MOG doesn’t really have any utility beyond the meme appeal and its community following, but the ETF buzz and renewed social media excitement are definitely keeping people interested. (This is all based on news through mid-February 2026.)
Looking at the technical side, platforms like Investing.com are calling MOG a “Strong Buy” on the daily chart. They’re pointing to things like a 14-day RSI sitting around 67.8—which means it’s not overbought yet—plus friendly moving averages across medium and long-term windows, along with bullish momentum and volatility indicators. Pivot points are hovering near 1.9×10⁻⁷ USDT, giving us some handy short-term levels to watch for resistance and support. (All of this comes from the latest publicly available data.)
Chart Patterns and Key Technical Indicators
When you dig into the charts, you can see MOG has broken out of some classic patterns that traders love to spot. On the daily timeframe, there’s a textbook cup-and-handle formation that got confirmed when price pushed through the neckline around ~0.00000148 USDT, then came back and successfully retested that level. On the 4-hour chart, a symmetrical triangle breakout above ~0.00000110 added even more fuel to the bullish case. Volume and trend strength tools like ADX are starting to pick up steam, which usually means the trend is getting some real legs under it. That said, we’ve got to stay realistic—there’s solid support around ~0.00000090 USDT, but resistance could be a real challenge all the way up to ~0.00000585 USDT. If momentum starts to fade, we could see some serious swings. (Cup-and-handle and triangle patterns come from mid-2025 analysis.)
Among the key indicators worth watching: MACD just crossed above its signal line, which is a nice sign that upward momentum is building. RSI is in the upper 60s but still below overbought territory, so there’s room for the price to run higher. Moving averages from MA20 through MA200 are all trending upward, though MA5 and MA10 are a bit all over the place—that might mean we’re due for some consolidation before the next leg up. ATR is showing elevated volatility, so buckle up for some spikes and dips along the way. (This is based on daily and weekly indicator readings.)
Support & Resistance Map
- Immediate Support: ~0.00000090-0.00000102 USDT – this is a psychological floor that’s held up during previous retests of breakout levels.
- Strong Resistance Zones: ~0.00000167 USDT (where we’ve been consolidating recently), then above that ~0.00000238 USDT (Fibonacci 1.272 extension), with a longer-term target way up at ~0.00000585 USDT (Fibonacci 1.618-1.786 level tied to the cup-and-handle projection).
- Pivots to Watch: The classic pivot series (R1, R2, R3) are all clustered near ~1.9×10⁻⁷—these are handy for intraday moves or short-term swing trades.
Price Projections: Scenarios for MOG/USDT
Based on what the charts are telling us, combined with recent news and catalysts, here are two main scenarios for MOG/USDT over the next month or two, plus a longer-term stretch goal.
Bullish Base Case: If price holds above ~0.00000167 USDT, we’re looking at a potential rally toward ~0.00000238 USDT. From where we are now, that’s roughly a +130-140% gain. The momentum indicators—especially ADX and MACD—suggest there’s enough strength to get us there, as long as volume keeps climbing. And if that spot ETF filing actually gets approved? That would be rocket fuel for this scenario.
Bearish or Neutral Case: If MOG breaks below ~0.00000090 USDT support, we could be in for a pullback toward earlier consolidation levels—maybe down to ~0.00000050-0.00000070 USDT. Volatility could get nasty. Watch for things like negative divergence on RSI or fading volume on breakout attempts as red flags. In this scenario, momentum fizzles out and those resistance levels above become really tough to crack.
Stretch Target (if Bulls Keep Running): If we bust through ~0.00000238 USDT with conviction, the door opens to ~0.00000585 USDT. That target comes from the Fibonacci extensions tied to the cup-and-handle breakout. Getting there would need strong, consistent buying pressure, a healthy broader market, and probably some extra positive news—think new exchange listings, actual utility announcements, or regulatory wins.
Risk Factors and Strategic Takeaways for Traders
Even though MOG’s chart looks pretty promising right now, there are definitely some risks you need to keep in mind:
- Massive supply and concentration: We’re talking about 390-400 trillion tokens floating around, with the top holders controlling over half the supply. That means if whales or team wallets decide to dump, the price can tank hard and fast.
- Lack of on-chain utility: Let’s be real—MOG doesn’t have any DeFi integrations, governance features, or revenue streams. It’s all about the meme and the community vibe. That makes price action driven almost entirely by sentiment rather than fundamentals.
- Regulatory risk: The SEC hasn’t exactly been friendly to novel ETFs, especially ones tracking memecoins. Just because there’s a filing doesn’t mean approval is coming. If it gets rejected, all those gains built on ETF hopes could evaporate overnight.
Strategy Suggestions: If you’ve got a higher risk tolerance, consider scaling into positions near support levels (0.00000090-0.00000110 USDT) with tight stop-losses. If you want more confirmation, wait for a solid daily close above 0.00000167 USDT with strong volume backing it up. Given the volatility, keep your position sizes reasonable and think about taking partial profits near resistance zones to lock in gains. For those eyeing that stretch target and willing to hold longer-term, just remember we’re still early in what could be a big move—don’t let impatience mess up your timing.