Current Context & Recent Moves
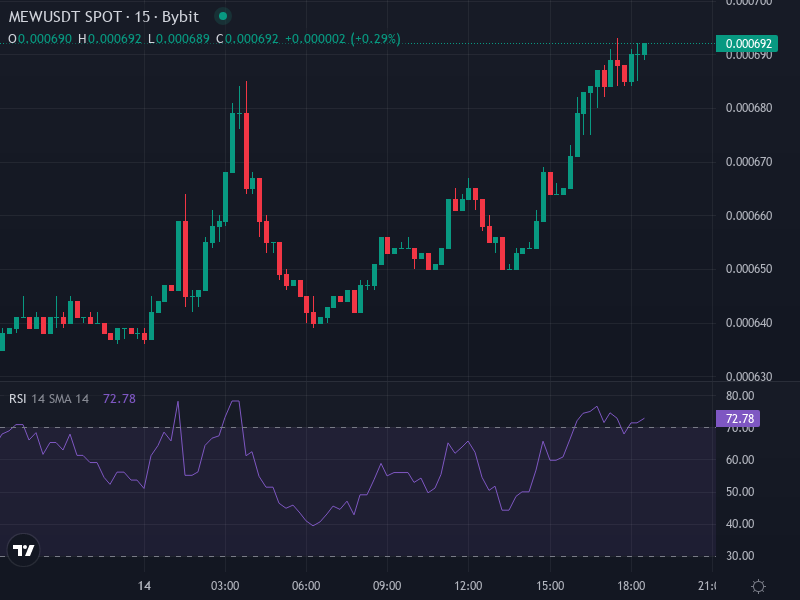
The meme-token Cat in a Dog’s World (MEW), traded as MEW/USDT, is sitting at around $0.0006896 right now, with a pretty impressive 24-hour jump of about +8.23%. This spike shows that traders are getting excited again after weeks of declining prices that pushed MEW through some important support levels. The whole meme-coin space—especially those cat-themed tokens—has been heating up lately, and that’s definitely adding some speculative energy to MEW’s recent bounce.
Looking at the basics, MEW is built on Solana and bills itself as an entertainment and IP-focused token. The whole concept is about cats being the heroes in “a world of barking dominance,” with plans to expand into merchandise, branding, governance, and community-driven activities. The tokenomics include burning LP tokens and a fixed supply of roughly 88.88 billion tokens. While these features help create scarcity and build the narrative, the actual utility is still pretty early-stage. People are split right down the middle between those who love the hype and those who remain skeptical.
Indicator-Based Technical Analysis
When you look at the technical indicators, MEW’s short to medium-term trend is still struggling:
- Relative Strength Index (RSI 14-period): Sitting around ~30-35 on shorter timeframes. This tells us MEW is getting close to oversold territory, though it’s not deeply oversold yet. The bearish momentum is still pretty dominant, with very few positive days recently.
- MACD (12-26 EMA crossover): The MACD line has dropped below its signal line, showing a bearish crossover and recent downward momentum. The histogram data points to increasing selling pressure taking over.
- ADX (Average Directional Index): Reading somewhere in the high 20s to low 30s, which means there’s a clear downward trend established, though it hasn’t reached extreme levels yet.
- Moving Averages: MEW is trading below its major EMAs (20, 50, 200), which means those medium and long-term averages are now acting as resistance overhead. The shorter MAs (5-10) are offering some minor support near the current price, but they’re pretty weak without any clear reversal signs.
- Volatility Indicators & Bollinger Bands: Low ATR values (about 0.8% of price) and the price hugging the lower Bollinger Band show compression happening. This could mean a bounce is coming if buyers show up, but without that buying pressure, the risk of breaking down increases.
When you put all this together, the short term looks weak but not hopeless. MEW is showing oversold signals on several indicators. Support zones are being tested right now, while resistance is sitting up near those major moving averages. For any strong move upward to happen, we’d need to see solid volume and some kind of catalyst—otherwise, sellers are probably going to keep control around these levels.
Support & Resistance Zones
Here are the key zones worth watching:
- Support Levels: The $0.00065 to $0.00060 range marks recent intraday lows. If we break below that zone, MEW could easily drop toward $0.00050, and if the momentum really picks up on the downside, we might even see $0.00030.
- Resistance Zones: The 20/50-period EMA zones are sitting roughly in the $0.0012-$0.0025 range. There’s also that psychological $0.001 level. That cluster represents strong resistance unless we get a big volume push to break through.
Price Prediction Scenarios
Based on what we’re seeing in the technicals and market sentiment, here are some realistic scenarios depending on how things play out:
- Bullish Reversal Case: If MEW manages to push back above its 20 and 50 EMA resistance around ~$0.0012 with strong volume (across both Solana DEXs and the major exchanges), we could see it aiming for $0.0020 in the medium term. Momentum could really kick in if there’s any news, partnership announcements, or another wave of cat-token seasonal hype. Under this scenario, we might see highs reaching $0.0025 by mid-2026 if conditions stay favorable. That lines up with some of the more optimistic analyst forecasts floating around.
- Base Case (Rangebound with Weak Upside): MEW stays trapped between support ($0.00060–$0.00080) and resistance (around $0.0012), unable to break out cleanly either direction. The price consolidates or slowly creeps higher toward those EMAs before getting rejected again. Traders might see some small bounces here and there, but overall sentiment stays cautious and uncertain.
- Bearish / Pullback Case: A clean break below that support near $0.00060 would probably send MEW tumbling down pretty hard. The next significant support levels might be around $0.00030 or even lower, especially if the broader market or memecoin sector takes a turn for the worse. The technical indicators suggest there’s definitely higher downside risk without some serious accumulation happening. Some previous analyst warnings pointed to risk zones around $0.0015 in reversal scenarios, but those depend heavily on support holding firm.