Recent Context & Market Drivers
Dogwifhat has carved out a space for itself in the wild world of meme coins, riding waves of social media hype, whale buying patterns, and unpredictable liquidity shifts. Lately, some analysts have been throwing around eye-popping numbers—talk of “1000% upside potential”—mostly fueled by spikes in wallet activity and community buzz rather than any real development updates. Sure, that generates excitement, but it also means you’re signing up for a rollercoaster of volatility.
From a technical standpoint, things have been pretty rough for WIF. Indicators like MACD, RSI, and ADX have been flashing bearish or neutral signals across multiple timeframes. The major moving averages—your 50-day, 100-day, and 200-day lines—have been acting more like brick walls than safety nets. Most analysts are saying the same thing: unless WIF can punch through resistance with real conviction and volume behind it, we’re probably looking at more downside ahead.
Key Technical Indicators & Interpretation
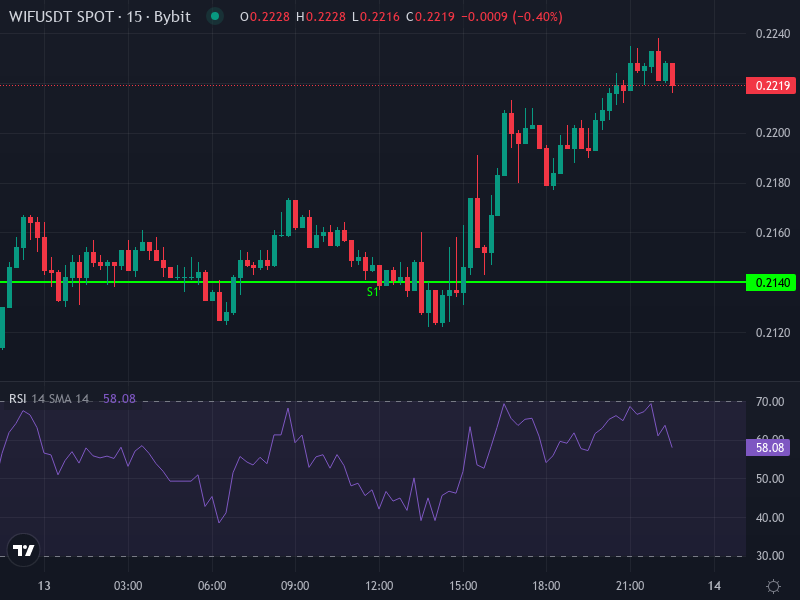
Looking at the current picture with WIF trading around $0.2222 and up about 4.6% in the last 24 hours, the 4-hour chart is painting a mixed story. RSI is hovering near 56.1—that’s moderately bullish territory, not overheated but showing some life. The MACD histogram is barely in the green, with the main line still trailing its signal, so we’re talking weak bullish momentum at best. The 4-hour EMA sits at roughly $0.2182, just below current price, offering a bit of short-term support, and the SMA around $0.2167 backs that up.
Zooming out to the daily timeframe, the pivot point analysis puts current price right around the pivot level of $0.219. Resistance levels are stacking up between $0.226 and $0.238, while support zones are clustered from $0.214 down to about $0.202. Here’s the catch though—the daily rate of change is sitting at around –11.6%, which tells you the recent drift has been downward. Broader technical consensus from various sources isn’t encouraging either, with most calling it a “Strong Sell” or firmly “Bearish,” pointing to price action below key moving averages, oversold RSI readings on longer timeframes, and failure to hold above major trend lines.
Short-Term Movement (Hours to 1–2 Days)
If WIF can hold above that 4-hour EMA around $0.2182 and the SMA near $0.2167, there’s a decent shot at testing the $0.230–$0.238 zone in the near term. Getting past that first resistance at $0.226 would open the door toward the R2 and R3 levels around $0.231–$0.238. But here’s the flip side: if price loses grip on the $0.214 support level, we could easily see it slide toward the next support cluster at $0.207–$0.202, especially if buying volume starts to dry up.
Mid-Term Outlook & Projection
When you step back and look at the bigger picture, upside momentum is facing some serious headwinds. For sentiment to actually shift, WIF needs to not just touch but actually hold above that daily resistance zone around $0.231–$0.240, and ideally start trading above those longer-term moving averages again. If it manages that—and that’s a big if—then a push toward $0.300 might be on the table. But getting there would probably need help from a broader altcoin rally, favorable macro conditions, and strong liquidity flowing into the space.
On the other hand, if those resistance levels keep holding firm, we’re probably looking at consolidation somewhere in the $0.200–$0.240 range. A breakdown below $0.200 could get ugly fast, potentially dragging price down to the next major support zone between $0.150 and $0.180, depending on how the overall market is behaving. Keep a close eye on volume, RSI levels (especially if we hit oversold territory), and any MACD divergence patterns—those will be your early warning signals.
Risk Factors & Trade-Alerts
Let’s be real: this is a high-volatility setup. Big intraday swings are par for the course here, especially given the ATR readings that have been showing up in recent analysis. If you’re trading this, tight risk management isn’t optional—it’s essential. Consider stop-losses below that $0.214 support level, keep position sizes conservative, and pay attention to whale movement and social sentiment shifts. False breakouts are a real danger here, especially those moves above resistance that happen on weak volume—those tend to reverse hard and fast.